Adding a Chart
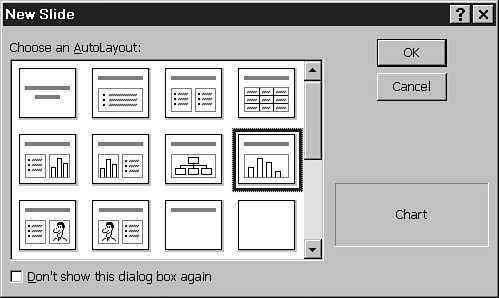
![]() The fastest way to add a chart to your PowerPoint presentation is to select one of the AutoLayouts from the New Slide dialog box, such as Chart, Text & Chart, and Chart & Text. To access this dialog box, shown in Figure 9.4, select the New Slide button from the Standard toolbar or choose Common Tasks, New Slide from the Formatting toolbar.
The fastest way to add a chart to your PowerPoint presentation is to select one of the AutoLayouts from the New Slide dialog box, such as Chart, Text & Chart, and Chart & Text. To access this dialog box, shown in Figure 9.4, select the New Slide button from the Standard toolbar or choose Common Tasks, New Slide from the Formatting toolbar.
Figure 9.4. The New Slide dialog box includes several AutoLayouts that include charts.

→ To learn more about how slide layouts affect your presentation, see "Understanding Slide Layouts,"
Tip
Get Special Edition Using Microsoft® PowerPoint® 2000 now with the O’Reilly learning platform.
O’Reilly members experience books, live events, courses curated by job role, and more from O’Reilly and nearly 200 top publishers.

