3 The Hearing Process
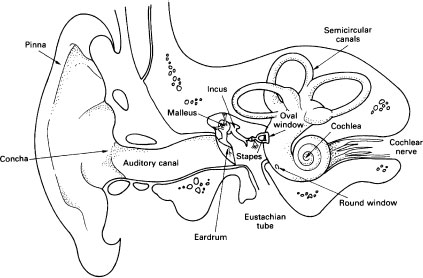
Figure 6 The structure of the ear (after Kessel and Kardon (1979))
The Response of the Ear to Different Frequencies
This is best shown graphically, as in Figure 8. Each line is an equal loudness curve. See below for an explanation of Phons.
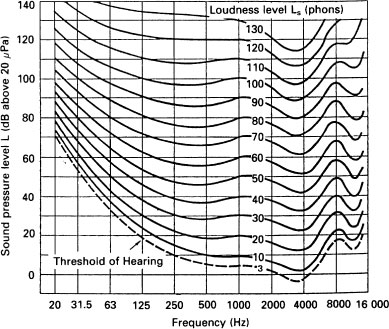
Figure 8 Equal loudness curves (from Robinson and Dadson (1956))
The reference zero, a sound pressure level (SPL) of 0 dB, is taken to be a pressure of 20 μPa (0.000 02 N/m2).
Frequency Discrimination
The smallest change in frequency that can be detected is known as the frequency ...
Get Sound Engineer's Pocket Book, 2nd Edition now with the O’Reilly learning platform.
O’Reilly members experience books, live events, courses curated by job role, and more from O’Reilly and nearly 200 top publishers.

