Chapter 10. Techniques for data mining in an operational warehouse 393
10.4.2 Breakdown by cluster report
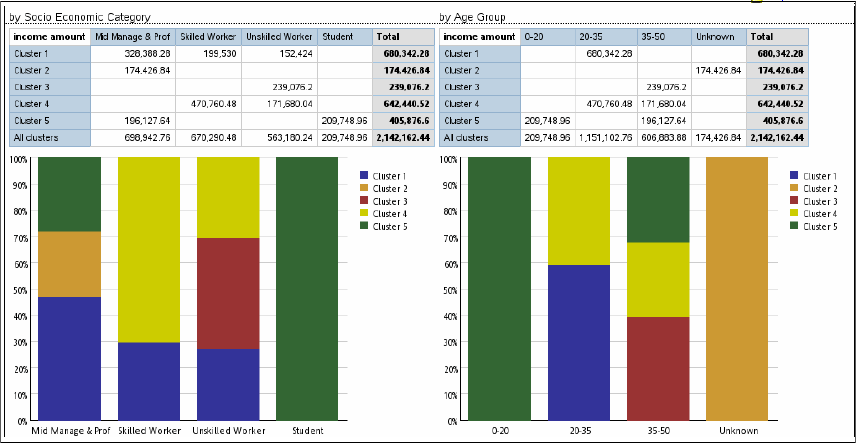
Figure 10-19 shows a more detailed breakdown of income by cluster can be
seen in the next report.
Figure 10-19 Income breakdown by cluster and profile
This report presents a further breakdown of the customer clustering by two
profile categories: socio-economic category and age group. The data points for
each cluster-profile category tuple is shown both in a cross-tab form and as a
proportional bar graph. As with the earlier report, this type of visualization makes
it easy for a business analyst or manager to quickly identify the customer group
of interest to take some action or decision on that group.
The user and analyst of these reports does not see specifically the delineation of
what data is generated by mining methods and what information is generated by
other means or data collection. These examples demonstrate how data mining
methods and results can be easily integrated into Cognos 10 BI reports and
applications, thereby making the information consumable by the user or analyst
without requiring them to be data mining experts.
394 Solving Operational Business Intelligence with InfoSphere Warehouse Advanced Edition
Get Solving Operational Business Intelligence with InfoSphere Warehouse Advanced Edition now with the O’Reilly learning platform.
O’Reilly members experience books, live events, courses curated by job role, and more from O’Reilly and nearly 200 top publishers.

