368 Solving Operational Business Intelligence with InfoSphere Warehouse Advanced Edition
parental status, and so on. The system can then use predictive models
(
classification) to generate a credit risk score in real time that can be used as a
basis for either denying the application outright, or recommending for approval.
The scoring might also be used to indicate a best fit interest rate or repayment
terms, depending on risk level. The process might be more nuanced in that the
system makes a recommendation that is then followed up by a loan agent. The
process might also be used for over-the-phone applications or account changes.
The process for designing, training, validating, and deploying the predictive data
mining model in this scenario is the same as in the case of credit card fraud
previously described. The scoring method must be integrated with or otherwise
invokable from the online application or help-desk application, wherever the
business process is being driven, either by the consumer or company
representative. We discuss how these functions can be deployed for application
integration in subsequent sections in this chapter.
10.2 InfoSphere Warehouse Advanced Enterprise
Edition 10.1 tools and features for data mining
InfoSphere Warehouse Advanced Enterprise Edition 10.1 provides all of the
tools and features required to develop, train, validate, visualize, deploy, and
integrate data mining applications into an operational warehouse business
intelligence solution. Through the rest of this section, we review the InfoSphere
Warehouse features available to perform
Source data exploration
Data preparation
Modeling in Design Studio
Model validation and execution
Visualization
Scoring with other models through PMML
The data mining features of InfoSphere Warehouse is thoroughly described in
other IBM Redbooks publications, most notably InfoSphere Warehouse: A
Robust Infrastructure for Business Intelligence, SG24-7813. This section draws
heavily from that document at a summary level. For more detailed explanations
and examples, refer directly to InfoSphere Warehouse: A Robust Infrastructure
for Business Intelligence.
10.2.1 Source data exploration in InfoSphere Warehouse 10.1
After the business problem is identified and understood, and the data mining
method is selected to solve the problem, the next step in the process is source
Chapter 10. Techniques for data mining in an operational warehouse 369
data exploration. It is critical to understand where the input data is coming from,
how it is structured, and its granularity and relationship to other source data.
InfoSphere Warehouse 10.1 Design Studio has powerful features to explore and
profile the source data before modeling begins.
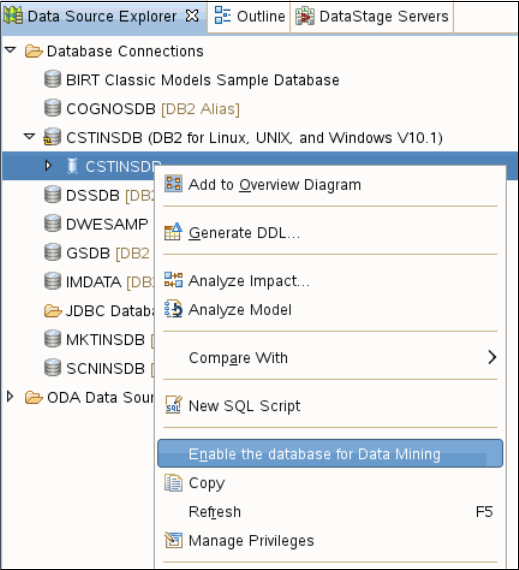
Database enablement
Before anything related to data mining can take place, the DB2 database must
be enabled for data mining. This is done by right-clicking the database name in
the Design Studio Data Source Explorer and selecting Enable Database for
Data Mining, as shown in Figure 10-1.
After DB2 is enabled, all data mining and data exploration function can be used.
Figure 10-1 Enabling DB2 for data mining
Source data exploration
InfoSphere Warehouse 10.1 Design Studio offers several functions to aid the
data mining modeling in the process of exploring the source data under
consideration.
370 Solving Operational Business Intelligence with InfoSphere Warehouse Advanced Edition
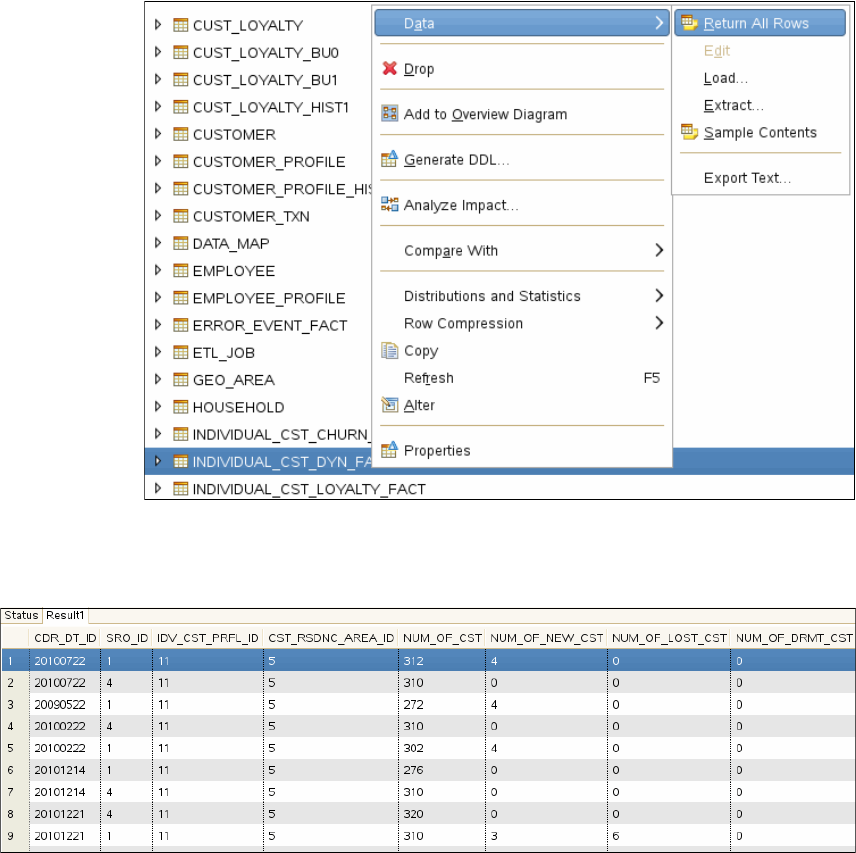
Browsing and sampling the data
In the Data Source Explorer, you can right-click a table and select to return all
rows of the table (with all columns) or to a sample set of the rows (with all
columns); see Figure 10-2.
Figure 10-2 Simple data exploration techniques in Design Studio
Figure 10-3 shows a sample result set.
Figure 10-3 Sample data results in Design Studio
Chapter 10. Techniques for data mining in an operational warehouse 371
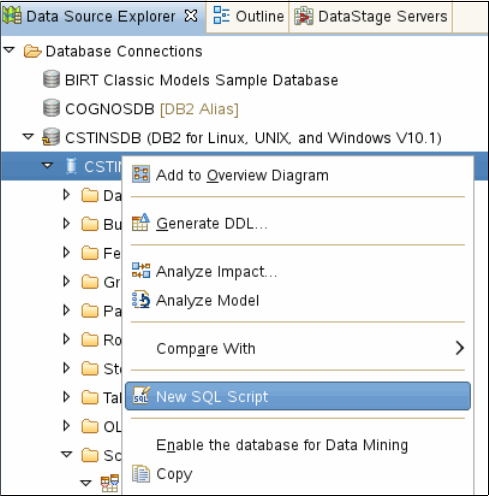
Multi-table exploration
You can use general purpose SQL queries to browse and explore data in the
source tables using Design Studio. Right-click the database and select New SQL
Script, as shown in Figure 10-4.
Figure 10-4 Using general-purpose SQL in Design Studio
This operation opens a script editor in which one or more semi-colon-delimited (;)
SQL statements can be entered. The results are viewed in the SQL Results tab
just like the results shown in Figure 10-3 on page 370.
Record value distribution analysis techniques
InfoSphere Warehouse 10.1 Design Studio also contains more sophisticated
data exploration techniques that use statistical analysis functions. The analysis
functions investigate value distributions on a column-by-column basis, and
illuminate relationships between values of columns. The following analyses are
available:
Univariate analysis
Univariate analysis shows both graphical and detailed value distribution
statistics for every column in the table. You can drill into the details for any
given column for information regarding the loyalty program participation for an
individual customer (from the Customer Insight example). See Figure 10-5 on
Get Solving Operational Business Intelligence with InfoSphere Warehouse Advanced Edition now with the O’Reilly learning platform.
O’Reilly members experience books, live events, courses curated by job role, and more from O’Reilly and nearly 200 top publishers.

