Chapter 15
Other Topics in the Use of Regression Analysis
15.1 It is possible, especially in small data sets, that a few outliers that follow the pattern of the “good” points can throw the fit off.
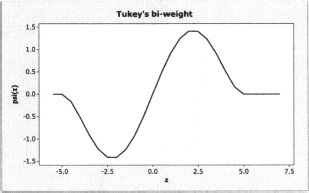
15.3 They are both oscillating functions that have similar shapes with Tukey’s bi-weight being a faster wave. However, Tukey’s bi-weight can exceed 1 while Andrew’s wave function cannot.
15.5 The fitted model is  = 2.34 − .288x1 + .248x2 + .45x3 − .543x4 + .005x5 with a couple of outliers.
15.7 a. The estimate is
b. First we solve the following
which gives d1 = −66.41 and d2 = 205.27. Then the confidence interval is
15.9 The normal-theory confidence interval for β2 is .014385±1.717(.003613) = (.0082, .0206). The bootstrap confidence interval is (.0073, .0240) which is similar to the normal-theory interval.
15.11 First, fit the model. Then, estimate the mean response at x0. Bootstrap this m times and store all of these mean responses. Finally, find the standard deviation of these responses. ...
Get Solutions Manual to Accompany Introduction to Linear Regression Analysis, 5th Edition now with the O’Reilly learning platform.
O’Reilly members experience books, live events, courses curated by job role, and more from O’Reilly and nearly 200 top publishers.

