Chapter 4
Model Adequacy Checking
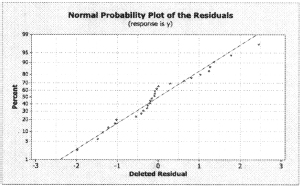
4.1 a. There does not seem to be a problem with the normality assumption.

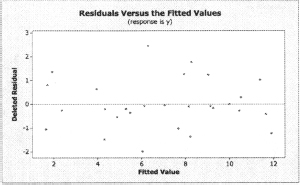
b. The model seems adequate.

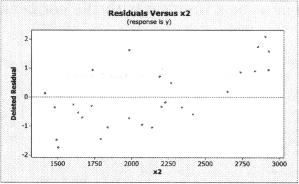
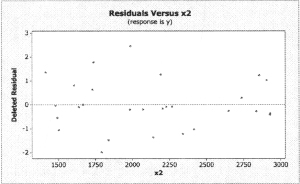
c. It appears that the model will be improved by adding x2.
4.2 a. There looks to be a slight problem with normality.
b. The plot looks good.
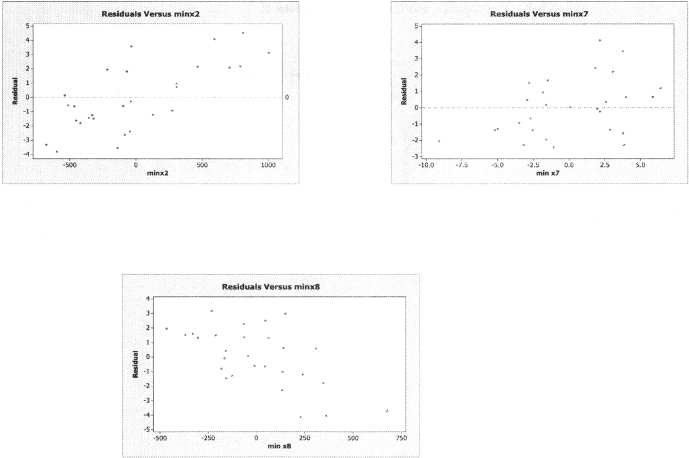
c. The plot for x8 looks ok, the plot for x2 shows mild nonconstant variance, and the plot for x7 exhibits nonconstant variance.
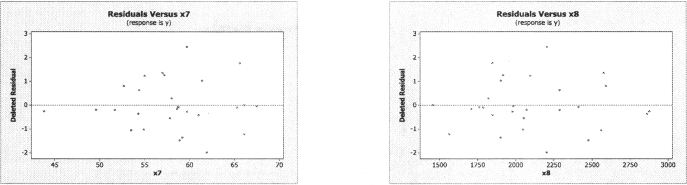
d. These plots indicate whether the relationships between the response and the regressor variables are correct. They show that there is not a strong linear relationship between the response and x7.
e. They can be used to determine influential points and outliers. For this ...
Get Solutions Manual to Accompany Introduction to Linear Regression Analysis, 5th Edition now with the O’Reilly learning platform.
O’Reilly members experience books, live events, courses curated by job role, and more from O’Reilly and nearly 200 top publishers.

