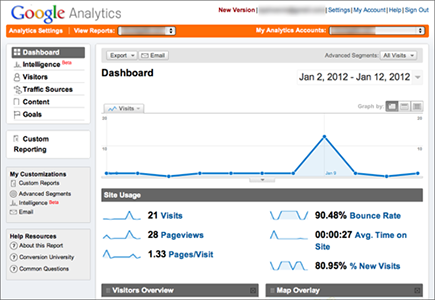
Figure 5-1: The Google Analytics graph of a new website
Battling Denial and Isolation
The biggest struggle you’ll face when embarking on metrics gathering and analysis is feeling alone and unheard at first. Any new campaign, website, Twitter account, Facebook page, or other item you want to measure starts at zero. This number can make you feel like you’re talking into a void, talking to yourself or that you’re hidden from view. This feeling can lead to an overall sense of isolation as you look at stagnant metrics numbers.
The typical Google Analytics graph of a website that just launched looks like Figure 5-1.
You can see that this site has had only 21 visitors in one week. If you’re looking for the validation of people visiting your site and reading your blog, this metric can be a harsh feeling! What these numbers don’t tell you is that increased targeted content will drive up your visits and conversions considerably. Add in social media sharing, and your site traffic will also become much healthier, which will be captured (and trackable) in future graphs.
 Make sure that you build your website or blog on a domain that you host or that you pay to host! These days, getting a
 .com for your domain name URL isn’t as important as it used to be — you can make do with .net and so on, ...
Get Social Media Metrics For Dummies now with the O’Reilly learning platform.
O’Reilly members experience books, live events, courses curated by job role, and more from O’Reilly and nearly 200 top publishers.

