Appendix 2
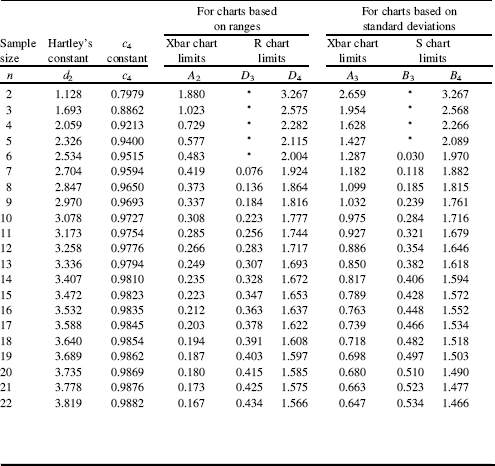
Factors for Control Charts


An asterisk indicates that the corresponding chart limit is set to zero.
When using ranges an estimate of process standard deviation is:
![]()
When using standard deviations a recommended estimate of process standard deviation, discussed in Chapter 5, is:
![]()

