The Metrics Explorer tab allows you to add and configure any additional charts and tables you wish to deploy. As mentioned previously, you can add/remove custom charts in other tabs as well.
To create a new chart in Metrics Explorer, perform the following steps:
- Click on Add Chart.
- Configure the display settings of the new chart.
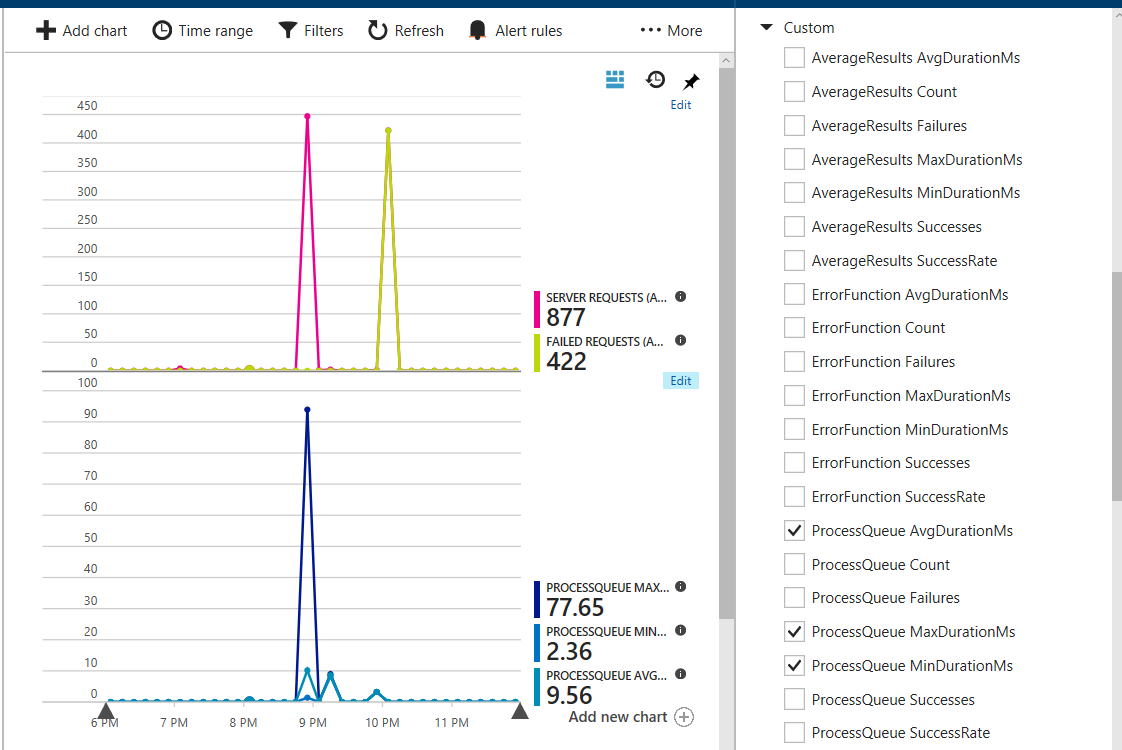
- Chose the metrics you wish to display. All of the metrics reported by the Function App will be available in the metrics list, as shown in the following screenshot:
To learn more about the dashboard configuration options, visit https://docs.microsoft.com/en-us/azure/application-insights/app-insights-metrics-explorer ...

