Chapter 1. ScreenOS CLI, Architecture, and Troubleshooting
1.0. Introduction
If you’re a network professional with network OS experience, ScreenOS has a fairly straightforward CLI to get used to. With that being said, it is important to lay the groundwork for how to move around the CLI and understand the troubleshooting capabilities within ScreenOS so that you are prepared to use the information in this book.
Each vendor produces and maintains its own device OS and defines the main keywords used to perform various configuration and information management functions. The keywords in ScreenOS provide the flexibility and structure required to manage the firewall via the CLI. They are:
getset/unsetsaveclearexecdeleteregex support
You can see these upon successful login to the firewall by issuing the “next option” command, better known as ?, at the prompt:
	Login: netscreen
	Password: <netscreen>

	top-ssg140->  ?
	clear clear           dynamic system info
	delete                delete persistent info in flash
	exec                  exec system commands
	exit                  exit command console
	get                   get system information
	mtrace                multicast traceroute from source to destination
	ping                  ping other host
	reset                 reset system
	save                  save command
	set                   configure system parameters
	trace-route           trace route
	unset                 unconfigure system parameters
	top-ssg140->
Unlike some other network OSs, there is a single level of access in ScreenOS, based on the permissions associated with the login credentials. ScreenOS provides the ? as a helper. You can find the same information by pressing the Tab key to either complete a command if it is unique, or provide the user options.
get
Generally, you use the get keyword to show the status or value of some ScreenOS function, such as an interface, log buffer, or routing table. You can filter the output from the get command to provide more concise output and then dump it to the screen (default behavior), or redirect it to a Trivial File Transfer Protocol (TFTP) server and text file for further analysis. Also available is a very rich REGEX filtering function, which we will describe in more detail later in this section.
top-ssg140->get ?address show address book admin show admin information adsl show adsl info alarm show alarm info alg application layer gateway information alg-portnum get ALG port num alias get alias definitions arp show ARP entries asp asp attack show attacks auth show authentication information auth-server authentication server settings chassis show chassis information clock show system clock config show system configuration console show console parameters core-dump show core dump parameters counter show counters di get deep inspection parameters dialer get dialer information dip show all dips in a vsys or root dip-in show incoming dip table info --- more --- top-ssg140->get interface e0/0Interface ethernet0/0: description ethernet0/0 number 0, if_info 0, if_index 0, mode nat link up, phy-link up/full-duplex vsys Root, zone Trust, vr trust-vr dhcp client disabled PPPoE disabled admin mtu 0, operating mtu 1500, default mtu 1500 *ip 192.168.1.1/24 mac 0017.cb47.8d00 *manage ip 192.168.1.1, mac 0017.cb47.8d00 route-deny disable pmtu-v4 disabled ping enabled, telnet enabled, SSH enabled, SNMP enabled web enabled, ident-reset disabled, SSL enabled DNS Proxy disabled, webauth disabled, webauth-ip 0.0.0.0 OSPF disabled BGP disabled RIP disabled RIPng disabled mtrace disabled PIM: not configured IGMP not configured NHRP disabled bandwidth: physical 100000kbps, configured egress [gbw 0kbps mbw 0kbps] configured ingress mbw 0kbps, current bw 0kbps total allocated gbw 0kbps DHCP-Relay disabled at interface level DHCP-server disabled Number of SW session: 56063, hw sess err cnt 0 top-ssg140->
set/unset
The set and unset commands are the primary keywords for effecting change of the firewall configuration. These changes occur in real time and have led many administrators to make a trip to the data center to log in via the console because an IP address or route was misconfigured or accidentally changed.
	top-ssg140-> set interface ethernet0/0 ?
	bandwidth            interface bandwidth
	description          configure interface description
	dhcp                 dhcp server/client/relay setup
	dip                  dynamic ip configuration
	dot1x                enable IEEE802.1X feature
	ext                  extended DIP configuration
	gateway              gateway ip address
	group                group interface into redundant interface
	ip                   set interface ip address
	manage               interface manageability
	manage-ip            interface management ip address
	mip                  mapped ip configuration
	monitor              interface monitoring
	mtu                  set maximum transfer unit
	nat                  private address
	pbr                  Enable interface pbr-policy
	phy                  interface physical feature
	pmtu                 path MTU discovery configuration
	protocol             configure routing protocol parameters
	proxy                enable interface proxy application
	route                public address
	route-deny           deny traffic routing back to this interface
	webauth              webauth for this interface
	webauth-ip           webauth ip for this interface
	zone                 interface zone binding
	top-ssg140->
save
You use the save keyword to manage the configuration stored in flash memory. Any configuration change made via the console or a remote terminal session is not committed to flash memory until save is entered. If you forget this, and you reboot the firewall, those changes are lost.
top-ssg140->set interface ethernet0/0 ip 10.100.1.1/24top-ssg140->set interface ethernet0/0 manage-ip 10.100.1.2top-ssg140->get interface | include eth0/0eth0/0 10.100.1.1/24 Trust 0017.cb47.8d00 - U - top-ssg140->resetConfiguration modified, save? [y]/nnSystem reset, are you sure? y/[n]yIn reset ... ... boot sequence ... login:netscreenpassword:<password>top-ssg140-> top-ssg140->get interface | include eth0/0eth0/0 192.168.1.1/24 Trust 0017.cb47.8d00 - U - top-ssg140->
Notice that ScreenOS provides the administrator an opportunity to bail out of the reset process and save the configuration. Also note that the IP address for ethernet0/0 has reverted back to the ScreenOS default of 192.168.1.1/24.
Another handy capability of save is that it allows you to save your configuration to a TFTP server. For example, you can have an off-box script run occasionally to log in to the device and run this command to back up the configuration:
	top-ssg140->  save config to tftp 10.251.7.113 config.txt
	Read the current config.
	Save configurations (4103 bytes) to config.txt on TFTP server
	    10.251.7.113.
	!!!!!!!!!!!!!!!!!!!!
	tftp transferred records = 9
	tftp success!

	TFTP Succeeded
	top-ssg140->
You can also manage the ScreenOS image via the save keyword. The administrator can save a copy of the image to a TFTP server or from a TFTP server:
	top-ssg140-> save software from flash to tftp 10.251.7.113
	    ssg140.6.0.0r1.0
	Save software to 10.251.7.113 ssg140.6.0.0r1.0
	!!!!!!!!!!!!!!!!!!!!!!!!!!!!!!!!!!!!!!!!!!!!!!!!!!!!!!!!!!!!!!!!!!!
	...
	!!!!!!!!!!!!!!!!!!!!!!!!!!!!!!!!!!!!!!!!!!!!!!
	tftp transferred records = 21761
	tftp success!

	TFTP Succeeded
	top-ssg140->
We cover saving the image from a TFTP server later in this chapter, in Recipe 1.1.
clear
You use the clear keyword to erase or purge information from the firewall’s realtime memory, not the onboard flash memory. You can use clear to manage the following:
The Address Resolution Protocol (ARP) cache
Session table entries
Internet Key Exchange (IKE) Security Associations (SAs)
IKE cookies
Logs
Counters
The clear function is particularly useful when troubleshooting problems, as it is very common to be asked to provide Juniper Technical Assistance Center (JTAC) engineers with a current snapshot of information, which requires resetting logs and counters. Another good example is when performing debug or snoop functions. The buffer where the output is stored should be cleared before each run so that maximum buffer space is available, and the troubleshooter knows the information in the buffer is pertinent to the problem at hand.
exec
The exec keyword has a limited but powerful set of options for managing a specific set of functions. The “root” admin is the only account with access to exec functions. Typically, you use the exec command to manually force the device to execute a function that, under normal circumstances, happens automatically. As such, most administrators will rarely use it unless under the direction of JTAC.
	top-ssg140-> exec ?
	admin                 exec ADMIN commands
	alg                   application layer gateway information
	attack-db             perform attack database update or checking
	auth                  user authentication actions
	config                config exec command
	dhcp                  exec dhcp command
	dialer                exec dialer commands
	dns                   refresh all dns entries
	igmp                  IGMP
	ike                   IKE exec commands
	infranet              Infranet Confroller configuration
	interface             Interface configuration
	license-key           set feature configuration
	log                   exec log commands
	nsrp                  exec nsrp commands
	ntp                   exec ntp command
	password              perform password verification
	pki                   PKI exec commands
	policy                policy verify
	pppoa                 maintain pppoa connection
	pppoe                 maintain pppoe connection
	proxy-id              exec proxy id update command
	save                  save command
	script                exec script
	shdsl                 SHDSL pic-mode
	ssh                   exec SSH commands
	syslog                syslog configuration
	usb-device            exec usb command
	vrouter               execute vrouter commands
	top-ssg140->
delete
The delete keyword has a small but effective set of options for managing a specific set of meters mostly regarding information stored in flash memory:
	top-ssg140-> delete
	cluster                 cluster option
	crypto                  delete crypto info
	file                    delete a file
	node_secret             clear SecurID stored node secret
	nsmgmt                  delete nsmgmt private/public keys
	pki                     delete a PKI object
	ssh                     delete SSH
	top-ssg140->
Sometimes it is necessary to delete Secure Shell (SSH) keys or even NetScreen Security Manager (NSM) keys to reestablish communication.
Filtering the Output
ScreenOS provides several ways to filter output. You can use two different keywords after a pipe (|): include and exclude. ScreenOS also supports the POSIX implementation of regular expressions (regexes), although not with every option. Regexes are a powerful way to filter the output of a command to show only what is wanted. It is beyond the scope of this book to fully define how POSIX regexes are implemented, but you can find this information via the Internet or on a Linux station manpage.
This section will cover how to use the different options to make it easier to find information in ScreenOS.
To compare the difference in filtering output, we will examine the routing table. Here is the output for the routes in the trust-vr:
	bottom-ssg140-> get vrouter trust route summary
	trust-vr
	------------------------------------------------------------------
	  Route Source             Networks   Subnets    Supernets
	------------------------------------------------------------------
	 Connected                     0         3          0
	 Host                          0         3          0
	 Static                       95       659          4
	 System Default                0         0          0
	 OSPF                          0         0          0
	  [ OSPF Intra area            0         0          0  ]
	  [ OSPF Inter area            0         0          0  ]
	  [ OSPF External - 1          0         0          0  ]
	  [ OSPF External - 2          0         0          0  ]
	 BGP                           0         0          0
	 RIP                           0         0          0
	 NHRP                          0         0          0
	 Imported                      0         0          0
	 Auto Exported                 0         0          0
	 Auto Discovered               0         0          0

	 Total 764/max entries
	bottom-ssg140->
There are 764 routes, which can take a little while to get through if you’re looking for a specific route or a set of routes. Instead, use the include keyword to find any route in the 159.24.0.0 Class B range:
	bottom-ssg140-> get route | inc 159.24
	*  764  159.24.119.232/32    eth0/2     10.10.10.1   S  20  1  Root
	*  756  159.24.107.242/32    eth0/2     10.10.10.1   S  20  1  Root
	*  390  159.24.200.100/30    eth0/2     10.10.10.1   S  20  1  Root
	*  763  159.24.116.222/32    eth0/2     10.10.10.1   S  20  1 Root
	*  760  159.24.110.217/32    eth0/2     10.10.10.1   S  20  1 Root
	*  387     159.24.76.0/24    eth0/2     10.10.10.1   S  20  1 Root
	*  759  159.24.110.212/30    eth0/2     10.10.10.1   S  20  1 Root
	*  750  159.24.106.169/32    eth0/2     10.10.10.1   S  20  1 Root
	*  749  159.24.106.167/32    eth0/2     10.10.10.1   S  20  1 Root
	*  748  159.24.106.166/32    eth0/2     10.10.10.1   S  20  1 Root
	*  747  159.24.106.162/32    eth0/2     10.10.10.1   S  20  1 Root
	*  762  159.24.116.161/32    eth0/2     10.10.10.1   S  20  1 Root
	*  758  159.24.110.123/32    eth0/2     10.10.10.1   S  20  1 Root
	*  746  159.24.106.122/32    eth0/2     10.10.10.1   S  20  1 Root
	*  755   159.24.107.72/29    eth0/2     10.10.10.1   S  20  1 Root
	*  757   159.24.109.89/32    eth0/2     10.10.10.1   S  20  1 Root
	*  392  159.24.235.212/30    eth0/2     10.10.10.1   S  20  1 Root
	*  389  159.24.181.140/30    eth0/2     10.10.10.1   S  20  1 Root
	*  754  159.24.107.61/32     eth0/2     10.10.10.1   S  20  1 Root
	*  752  159.24.107.48/28     eth0/2     10.10.10.1   S  20  1 Root
	*  753  159.24.107.58/32     eth0/2     10.10.10.1   S  20  1 Root
	*  751  159.24.107.55/32     eth0/2     10.10.10.1   S  20  1 Root
	*  761  159.24.114.46/32     eth0/2     10.10.10.1   S  20  1 Root
	*  391 159.24.217.172/30     eth0/2     10.10.10.1   S  20  1 Root
	*  388    159.24.76.0/26     eth0/2     10.10.10.1   S  20  1 Root
	bottom-ssg140->
You can find the same information using regex commands; however, if you want to see only the /32 routes within the 159.24.0.0 Class B range, regex is the only option:
	bottom-ssg140-> get route | inc "159.24.{1,3}[[:digit:]].{1,3}
	[[:digit:]]\/32"
	*  764  159.24.119.232/32    eth0/2      10.10.10.1   S   20  1  Root
	*  756  159.24.107.242/32    eth0/2      10.10.10.1   S   20  1  Root
	*  763  159.24.116.222/32    eth0/2      10.10.10.1   S   20  1  Root
	*  760  159.24.110.217/32    eth0/2      10.10.10.1   S   20  1  Root
	*  750  159.24.106.169/32    eth0/2      10.10.10.1   S   20  1  Root
	*  749  159.24.106.167/32    eth0/2      10.10.10.1   S   20  1  Root
	*  748  159.24.106.166/32    eth0/2      10.10.10.1   S   20  1  Root
	*  747  159.24.106.162/32    eth0/2      10.10.10.1   S   20  1  Root
	*  762  159.24.116.161/32    eth0/2      10.10.10.1   S   20  1  Root
	*  758  159.24.110.123/32    eth0/2      10.10.10.1   S   20  1  Root
	*  746  159.24.106.122/32    eth0/2      10.10.10.1   S   20  1  Root
	*  757   159.24.109.89/32    eth0/2      10.10.10.1   S   20  1  Root
	*  754   159.24.107.61/32    eth0/2      10.10.10.1   S   20  1  Root
	*  753   159.24.107.58/32    eth0/2      10.10.10.1   S   20  1  Root
	*  751   159.24.107.55/32    eth0/2      10.10.10.1   S   20  1  Root
	*  761   159.24.114.46/32    eth0/2      10.10.10.1   S   20  1  Root
	bottom-ssg140->
The exclude keyword is used more rarely, but a good example of its use is to show the routing table without Host or /32 routes:
	bottom-ssg140-> get route | exclude /32


	IPv4 Dest-Routes for <untrust-vr> (0 entries)
	--------------------------------------------------------------------------------
	H: Host C: Connected S: Static A: Auto-Exported
	I: Imported R: RIP P: Permanent D: Auto-Discovered
	N: NHRP
	iB: IBGP eB: EBGP O: OSPF E1: OSPF external type 1
	E2: OSPF external type 2 trailing B: backup route


	IPv4 Dest-Routes for <trust-vr> (764 entries)
	--------------------------------------------------------------------------------
	    ID          IP-Prefix     Interface         Gateway    P  Pref    Mtr   Vsys
	--------------------------------------------------------------------------------
	*    9          0.0.0.0/0        eth0/2      10.10.10.1    S    20      1   Root
	*  668   192.168.151.0/24        eth0/0     10.251.7.97    S    20      1   Root
	*   43       10.11.0.0/16        eth0/0     10.251.7.97    S    20      1   Root
	*  169   137.237.154.0/24        eth0/2      10.10.10.1    S    20      1   Root
	*   10       10.15.0.0/29        eth0/0     10.251.7.97    S    20      1   Root
	*  168   137.237.153.0/24        eth0/2      10.10.10.1    S    20      1   Root

	...

	*  274 152.161.208.164/30        eth0/2      10.10.10.1    S    20      1   Root
	*  374   158.147.188.0/24        eth0/2      10.10.10.1    S    20      1   Root
	Too many matched lines, rest ignored.
	bottom-ssg140->
Filtering can provide many other powerful benefits, such as the ability to filter a large session table. In the following example, we request a session table from the device that includes only IP address 192.168.1.1:
	top-ssg140-> get session | include 192.168.1.1

	if 2(nspflag 801801):192.168.1.100/3703->172.24.18.251/1222,6,
	   000d605ff552,sess token 4,vlan 0,tun 0,vsd 0,route 1
	if 2(nspflag 800601):192.168.1.100/3706->192.168.1.1/23,6,
	   000d605ff552,sess token 4,vlan 0,tun 0,vsd 0,route 1
	if 3(nspflag 0010):192.168.1.100/3706<-192.168.1.1/23,6,000000000000,
	   sess token 8,vlan 0,tun 0,vsd 0,route 0

	top-ssg140->
Tip
You can shorten many of the ScreenOS commands when entering themat the keyboard or in a script, as long as you provide enough characters to make the command unique. For example, get session is the same as get sess.
There are limits to the amount of data that can be filtered; if very large amounts of data must be filtered, it is best to save the data to a text file and use a word processing tool or more traditional *NIX tools.
1.1. ScreenOS Architecture
ScreenOS takes a hierarchical approach with regard to the firewall’s framework configuration. The framework configuration determines how the firewall will communicate on the network fromLayers 1–3, and it consists of routing, security zones, and interfaces.
It is easy to get started with ScreenOS, and the impulse is to immediately put IP addresses on interfaces, add some routes, create Address Book entries, and to start writing policies. However, be careful when dealing with more complex environments. We will address the three key ScreenOS building blocks in the order an administrator should consider them to avoid a lot of rework or, worse, rearchitecting a network design midstream.
Virtual Router
ScreenOS architecture utilizes the Virtual Router (VR), trust-vr, as the parent container and as the first architectural choice to be made when designing ScreenOS into an existing or new network (see Figure 1-1).
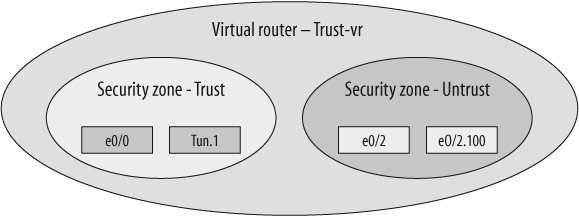
Two VRs are enabled on every platform that runs ScreenOS: trust-vr and untrust-vr:
	bottom-ssg140-> get vrouter
	* indicates default vrouter
	A - AutoExport, R - RIP, N- NHRP, O - OSPF, B - BGP, P - PIM

	   ID Name           Vsys    Owner    Routes    MRoutes     Flags
	    1 untrust-vr     Root    shared     0/max      0/max
	*   2 trust-vr       Root    shared     5/max      0/max

	total 2 vrouters shown and 0 of them defined by user
	bottom-ssg140->
However, trust-vr is the default VR and, therefore, the default container for all the underlying associated zones and interfaces:
	bottom-ssg140-> get vrouter trust-vr
	Routing Table
	---------------------------------------------------------------------
	H: Host C: Connected S: Static A: Auto-Exported
	I: Imported R: RIP P: Permanent D: Auto-Discovered
	N: NHRP
	iB: IBGP eB: EBGP O: OSPF E1: OSPF external type 1
	E2: OSPF external type 2 trailing B: backup route

	Total 5/max entries

	    ID          IP-Prefix    Interface     Gateway   P Pref Mtr  Vsys
	---------------------------------------------------------------------
	*   1     10.251.7.96/27      eth0/0       0.0.0.0  C    0    0  Root
	*   6      10.100.1.0/24      eth0/2    10.10.10.1  S   20    1  Root
	*   2      10.251.7.99/32     eth0/0       0.0.0.0  H    0    0  Root
	*   4     10.10.10.254/32     eth0/2       0.0.0.0  H    0    0  Root
	*   3       10.10.10.0/24     eth0/2       0.0.0.0  C    0    0  Root
	Interfaces

	---------------------------------------------------------------------
	self, v1-trust, v1-untrust, v1-dmz, l2v, ethernet0/0
	serial1/1, serial1/0, ethernet0/2, ethernet0/1, vlan1, hidden.1
	tunnel

	Auto-exporting:                 Disabled
	Default-vrouter:                Yes
	Shared-vrouter:                 Yes
	nsrp-config-sync:               Yes
	System-Default-route:           Not present
	Advertise-Inactive-Interface:   Disabled
	Source-Based-Routing:           Disabled
	SIBR-Routing:                   Disabled
	SNMP Trap:                      Public
	Ignore-Subnet-Conflict:         Disabled
	ECMP-Routing:                   Disabled
	bottom-ssg140->
You can divide this information into a couple of sections; first, the routing table:
	Total 5/max entries

	   ID          IP-Prefix    Interface    Gateway    P Pref  Mtr  Vsys
	---------------------------------------------------------------------
	*   1     10.251.7.96/27      eth0/0      0.0.0.0   C    0    0  Root
	*   6      10.100.1.0/24      eth0/2   10.10.10.1   S   20    1  Root
	*   2     10.251.7.99/32      eth0/0      0.0.0.0   H    0    0  Root
	*   4    10.10.10.254/32      eth0/2      0.0.0.0   H    0    0  Root
	*   3      10.10.10.0/24      eth0/2      0.0.0.0   C    0    0  Root
Note that ScreenOS creates a /32 Host entry for each directly connected interface, as well as the Network entry. Also, the asterisk (*) at the far left indicates that the route is installed in the Routing Information Base (RIB) and is available and active for use. The ID is the route ID from the RIB, which can be useful when troubleshooting flows, and note that duplicate, equal cost routes are available.
The Interfaces information section provides a visual list so that you can at least verify expected behavior. The interfaces listed here inherit the VR relationship from their zone assignment:
	Interfaces
	---------------------------------------------------------------------
	self, v1-trust, v1-untrust, v1-dmz, l2v, ethernet0/0
	serial1/1, serial1/0, ethernet0/2, ethernet0/1, vlan1, hidden.1
	tunnel
We will discuss routing in more detail in Chapter 4.
Zones
Zones are the foundation of the security architecture within ScreenOS. You can see a simple list of zones by typing get zone at the command prompt:
	bottom-ssg140-> get zone
	Total 14 zones created in vsys Root - 8 are policy configurable.
	Total policy configurable zones for Root is 8.
	--------------------------------------------------------------
	  ID Name           Type    Attr    VR          Default-IF   VSYS
	   0 Null           Null    Shared untrust-vr   hidden       Root
	   1 Untrust        Sec(L3) Shared trust-vr     ethernet0/2  Root
	   2 Trust          Sec(L3)        trust-vr     ethernet0/0  Root
	   3 DMZ            Sec(L3)        trust-vr     ethernet0/1  Root
	   4 Self           Func           trust-vr     self         Root
	   5 MGT            Func           trust-vr     null         Root
	   6 HA             Func           trust-vr     null         Root
	  10 Global         Sec(L3)        trust-vr     null         Root
	  11 V1-Untrust     Sec(L2) Shared trust-vr     v1-untrust   Root
	  12 V1-Trust       Sec(L2) Shared trust-vr     v1-trust     Root
	  13 V1-DMZ         Sec(L2) Shared trust-vr     v1-dmz       Root
	  14 VLAN           Func    Shared trust-vr     vlan1        Root
	  15 V1-Null        Sec(L2) Shared trust-vr     l2v          Root
	  16 Untrust-Tun    Tun            trust-vr     hidden.1     Root
	--------------------------------------------------------------
ScreenOS contains many types of zones, but the two that are most commonly configured and used are the security and functional zones.
Security zone
A security zone (specifically, the Sec(L3) from the preceding output, which is a Layer 3 security zone for firewalls operating in Layer 3 mode) represents a logical area of trust within the firewall. There are differing degrees of trust, represented by creating more zones, and different methods of defining such. Within these areas of trust, Address objects get associated and can then be used to define the security policy within ScreenOS.
Unlike other security operating systems, there is no hierarchy of trust levels when it comes to zones. ScreenOS employs an implicit deny system, and requires the explicit definition of rules to allow communication between hosts in different areas of trust, or zones, and sometimes within the same zone (intra-zone). For example:
bottom-ssg140->get zone trustZone name: Trust, id: 2, type: Security(L3), vsys: Root,vrouter: trust-vr Intra-zone block: Off, attrib: Non-shared, flag:0x6208 TCP non SYN send reset: On IP/TCP reassembly for ALG on traffic from/to this zone: No Asymmetric vpn: DisabledPolicy Configurable: YesPBR policy: NoneInterfaces bound:1. Designated ifp is ethernet0/0 interface ethernet0/0(0x3e93844)DHCP relay enabled bottom-ssg140->
The pertinent details fromthe Trust zone properties shown in the preceding code are as follows:
The VR assignment,
trust-vr, is where all interfaces associated with theTrust zonewill look for routes.The
Intra-zoneblocksetting dictates whether to allow communication between hosts in the same zone without requiring an explicit rule.The
PolicyConfigurablesetting indicates whether the trust is policy-configurable (not all are).The
Interfaces boundsetting indicates whether interfaces are bound to the zone, which is very useful when troubleshooting.
Functional zones
There are several functional zones, and each one performs a specific task within ScreenOS.
The Self zone is used for traffic destined to and generated by the firewall itself. No physical interfaces are associated with, or security policies definable for, this zone. Rather, it is used internally to track this traffic.
The HA (High Availability) zone is where the dedicated HA interfaces on the NS5000 series are placed, and where interfaces to be used for HA on the ISG and SSG systems need to be placed to ensure proper functioning. The interfaces in this zone are not assigned IP addresses because the ScreenOS NetScreen Redundancy Protocol (NSRP) is a Layer 2 protocol.
The MGT zone is for dedicated interfaces to manage the firewall. This is the only functional zone where the interface associated with it can be assigned an IP address. However, traffic cannot pass through this zone to other zones. Details for the MGT zone are as follows:
bottom-ssg140->get zone mgtZone name: MGT, id: 5, type: Function, vsys: Root,vrouter:trust-vr Intra-zone block: On, attrib: Non-shared, flag:0x00a4 TCP non SYN send reset: On IP/TCP reassembly for ALG on traffic from/to this zone: NoPolicy Configurable: NoPBR policy: NoneInterfaces bound:0.DHCP relay enabled bottom-ssg140->
Note that in the preceding code, the MGT zone is not policy-configurable and that intra-zone blocking is enabled, which means that if there are many interfaces in this zone, the firewall will not allow communication between them. This zone tends to cause the most problems, as we will discuss in Recipe 2.3.
Interfaces
We’re discussing interfaces last because they are the final building blocks in this structured relationship of VR →Security Zone →Interface. There are many types of ScreenOS interfaces, and some will be discussed in more detail throughout the book. Here is a list of the default interfaces:
bottom-ssg140->get interfaceA - Active, I - Inactive, U - Up, D - Down, R - Ready Interfaces in vsys Root: Name IP Address Zone MAC VLAN State VSDeth0/0 10.251.7.99/27 Trust 0017.cb47.9400 - U -eth0/1 0.0.0.0/0 DMZ 0017.cb47.9405 - D - eth0/2 10.10.10.254/24 Untrust 0017.cb47.9406 - U - eth0/3 0.0.0.0/0 Null 0017.cb47.9407 - D - eth0/4 0.0.0.0/0 Null 0017.cb47.9408 - D - eth0/5 0.0.0.0/0 Null 0017.cb47.9409 - D - eth0/6 0.0.0.0/0 Null 0017.cb47.940a - D - eth0/7 0.0.0.0/0 Null 0017.cb47.940b - D - eth0/8 0.0.0.0/0 Null 0017.cb47.940c - D - eth0/9 0.0.0.0/0 Null 0017.cb47.940d - D - bgroup0/0 0.0.0.0/0 Null 0017.cb47.940e - D - bgroup0/1 0.0.0.0/0 Null 0017.cb47.9415 - D - bgroup0/2 0.0.0.0/0 Null 0017.cb47.9416 - D - serial1/0 0.0.0.0/0 Untrust N/A - D - serial1/1 0.0.0.0/0 Untrust N/A - D - vlan1 0.0.0.0/0 VLAN 0017.cb47.940f 1 D - null 0.0.0.0/0 Null N/A - U 0 bottom-ssg140->
Other interface types that must be manually configured are not listed here. These are generally considered "logical” interfaces, and they include:
Redundant
Aggregate
Bridge Group
VLAN
Loopback
Tunnel
Let’s start simply with a physical interface. An example of how the ScreenOS structure dictates configuration is the fact that an IP address cannot be configured if the interface is not associated with a zone:
bottom-ssg140->set interface e0/4 ip 10.20.20.1/28^-----unknown keyword ip bottom-ssg140->set int e0/4 zone trustbottom-ssg140->set int e0/4 ip 10.20.20.1/28bottom-ssg140->
A new feature in ScreenOS 6.0 is the ability to add a description to the interface to allow you to correlate information regarding how the interface is being utilized. This is a very useful function, especially in wide area network (WAN) environments when it is common to identify remote peers, provider, and other information to help in troubleshooting and fault analysis. You can use up to 31 characters in your interface description; if there are spaces in your description, you must bound your text with double quotation marks:
	bottom-ssg140->
	bottom-ssg140-> set interface e0/3 description "Local LAN -
	    Portsmouth, New Hampshire"
	Interface description "Local LAN - Portsmouth, New Hampshire" is
	    longer than 31 characters
	bottom-ssg140-> set interface e0/3 description "Local LAN -
	    Portsmouth, NH"
	bottom-ssg140->
Using ethernet0/0, eth0/0, as an example, the following output displays the currently assigned IP address, zone association (remember, this dictates which VR to use to find/manage routes), Layer 2 Media Access Control (MAC) address, virtual local area network (VLAN), status, and what virtual security device (VSD) it is associated to if High Availability (HA) is configured:
bottom-ssg140->get interface e0/0Interface ethernet0/0:description Local LAN - Portsmouth, NHnumber 0, if_info 0, if_index 0,mode nat link up, phy-link up/full-duplexvsys Root,zone Trust, vr trust-vrdhcp client disabled PPPoE disabled admin mtu 0, operating mtu 1500, default mtu 1500*ip 10.251.7.99/27 mac 0017.cb47.9400 *manage ip 10.251.7.99, mac 0017.cb47.9400route-deny disable pmtu-v4 disabledping enabled, telnet enabled, SSH enabled, SNMP enabled web enabled, ident-reset disabled, SSL enabledDNS Proxy disabled, webauth disabled, webauth-ip 0.0.0.0 OSPF disabled BGP disabled RIP disabled RIPng disabled mtrace disabled PIM: not configured IGMP not configured NHRP disabled bandwidth: physical 100000kbps, configured egress [gbw 0kbps mbw 0kbps] configured ingress mbw 0kbps, current bw 0kbps total allocated gbw 0kbps DHCP-Relay disabled at interface level DHCP-server disabled Number of SW session: 56062, hw sess err cnt 0 bottom-ssg140->
This output illustrates a few key points that dictate how ScreenOS behaves and responds. For example, mode nat is a key setting because it determines how packets traverse the firewall. It is the default setting for interfaces assigned to the Trust zone, and any packet originating from the Trust zone to the Untrust zone will be translated to the interface IP of the outbound interface. This is great for small office/home office use, but it is generally not desirable for data center or enterprise deployment when Network Address Translation (NAT) needs to be tightly administered. You can change it to mode route easily, as shown here, but it is just as easy to overlook it:
bottom-ssg140->get interface e0/0 | include modenumber 0, if_info 0, if_index 0,mode natbottom-ssg140->set interface e0/0 routebottom-ssg140->get interface e0/0 | include modenumber 0, if_info 0, if_index 0,mode routebottom-ssg140->
Tip
All other interfaces default to mode route, and the behavior of mode nat on the interface(s) in the Trust zone is different depending on the out-bound interface zone mapping. The best practice is for all interfaces to be in mode route to ensure consistent, predictable behavior and to perform NAT functions in the security policy.
When an IP address is assigned to an interface, ScreenOS defines the interface manage-ip to be the same address. This is verified in the interface detail output with an asterisk (*) next to the interface IP. You can change this setting to a different IP address, but it must be on the same network as the interface IP:
bottom-ssg140->get interface e0/0 | include manage *manage ip 10.251.7.99, mac 0017.cb47.9400bottom-ssg140->set interface e0/0 manage-ip 10.251.7.100bottom-ssg140->get interface e0/0 | include manage manage ip 10.251.7.100, mac 0017.cb47.9400bottom-ssg140->
Redundant
The redundant interface allows you to logically group physical interfaces to create Layer 1 resiliency. The physical interfaces must be in the same broadcast domain, but they can be connected to two different switches. Only one interface is active at any given time, and this is controlled by the primary option. Redundant interfaces are supported across the Juniper firewall product line.
bottom-ssg140->unset interface ethernet0/0 ipbottom-ssg140->set interface red1 zone trustbottom-ssg140->set int ethernet0/0 group red1redundant1 interface change physical state to Up bottom-ssg140->set int ethernet0/1 group red1bottom-ssg140->set interface red1 primary ethernet0/0bottom-ssg140->set interface red1 ip 10.251.7.99/27bottom-ssg140->get interface red1Interface redundant1: description redundant1 number 64, if_info 64512, if_index 0, mode nat link up, phy-link up/full-duplexRedundant port has 2 members: ethernet0/1; ethernet0/0;Active primary interface: ethernet0/0 Configured primary interface: ethernet0/0 vsys Root, zone Trust, vr trust-vr dhcp client disabled*ip 10.251.7.99/27 mac 0017.cb30.9705 *manage ip 10.251.7.99, mac 0017.cb30.9705pmtu-v4 disabled ping enabled, telnet enabled, SSH enabled, SNMP enabled web enabled, ident-reset disabled, SSL enabled DNS Proxy disabled, webauth disabled, webauth-ip 0.0.0.0 OSPF disabled BGP disabled RIP disabled RIPng disabled mtrace disabled PIM: not configured IGMP not configured NHRP disabled Number of SW session: 48063, hw sess err cnt 0 bottom-ssg140->
The naming convention is very strict; you must use red and then an integer number as the name, or you will get a syntax error. Note that the same controls are in place in terms of IP addressing, zone assignment, and so on (as just discussed); the fundamental difference is that you apply these configurations to the logical interface now instead of to the underlying physical interfaces.
The expected failover trigger is a loss of the physical link that will then force ScreenOS to switch over to the other physical link in the redundant group:
bottom-ssg140-> ethernet0/0 interface change physical state to Down redundant1 interface change physical state to Up bottom-ssg140->get interface red1Interface redundant1: description redundant1 number 64, if_info 64512, if_index 0, mode nat link up, phy-link up/full-duplex Redundant port has 2 members: ethernet0/1; ethernet0/0;Active primary interface: ethernet0/1 Configured primary interface: ethernet0/0vsys Root, zone Trust, vr trust-vr dhcp client disabled *ip 10.251.7.99/27 mac 0017.cb30.9705 *manage ip 10.251.7.99, mac 0017.cb30.9705 pmtu-v4 disabled ping enabled, telnet enabled, SSH enabled, SNMP enabled web enabled, ident-reset disabled, SSL enabled DNS Proxy disabled, webauth disabled, webauth-ip 0.0.0.0 OSPF disabled BGP disabled RIP disabled RIPng disabled mtrace disabled PIM: not configured IGMP not configured NHRP disabled Number of SW session: 48063, hw sess err cnt 0 bottom-ssg140->
This failure will not cause an NSRP failover unless the physical interface ethernet0/0 was being monitored instead of the redundant interface.
Aggregate
The aggregate interface allows you to logically group physical interfaces to increase bandwidth and create Layer 1 resiliency. Aggregate interfaces are supported on the ISG1000/2000 and NS5200/5400 Juniper firewalls. For example, configuring a twoport aggregate interface to a Cisco 6500 would look like this:
isg1000->set interface ethernet1/1 aggregate aggregate1isg1000->set interface ethernet1/2 aggregate aggregate1isg1000->set interface agg1 zone trustisg1000->set interface aggregate1 ip 192.168.4.1/26isg1000->set interface aggregate1 routeisg1000->get interface agg1Interface aggregate1: description aggregate1 number 64, if_info 64512, if_index 0, mode nat link up, phy-link up/full-duplexAggregate port has 2 members: ethernet1/1; ethernet1/2vsys Root, zone Trust, vr trust-vr dhcp client disabled*ip 192.168.4.1/26 mac 0017.cb30.2101 *manage ip 192.168.4.1, mac 0017.cb30.2101pmtu-v4 disabled ping enabled, telnet enabled, SSH enabled, SNMP enabled web enabled, ident-reset disabled, SSL enabled DNS Proxy disabled, webauth disabled, webauth-ip 0.0.0.0 OSPF disabled BGP disabled RIP disabled RIPng disabled mtrace disabled PIM: not configured IGMP not configured NHRP disabled bandwidth: physical 2000000kbps, configured egress [gbw 0kbps mbw 0kbps] configured ingress mbw 0kbps, current bw 0kbps total allocated gbw 0kbps Number of SW session: 1000063, hw sess err cnt 0 isg-1000->
Here’s how it would look on the Cisco side:
Router# configure terminal Router(config)#interface port-channel 1Router(config-if)#ip address 192.168.4.5 255.255.255.0Router(config-if)#endRouter(config)#interface range gigethernet 5/6-7Router(config-if)#channel-group 1 mode onRouter(config-if)#end
The naming convention for aggregate interfaces is also very strict; you must use agg and then an integer number as the name, or you will get a syntax error. As with redundant interfaces, the same controls are in place in terms of IP addressing, zone assignment, and such.
Note that there is no aggregation protocol configuration; ScreenOS does not support 802.3ad or any other LACP negotiation protocol. This means you will need to configure the ancillary network device, typically a standalone or chassis-based switch, to group their physical ports statically and disable any LACP protocol. Most switch vendors will support this configuration, and Juniper has tested it with Cisco, Foundry, and Riverstone.
The load-sharing algorithm within ScreenOS is round-robin on a per-packet basis. This has caused out-of-order packets on rare occasions, and most applications are written to account for this through retransmission at the Transport layer. You can configure the other device load-sharing algorithmin any way you want. If one of the physical interfaces fails in the Aggregate group, the bandwidth is reduced, and the number of ports to round-robin the packets will be as well, but the Aggregate port will not fail and trigger an NSRP failure. We cover this in more detail in Recipe 18.4.
Tip
The NS5000 family has two Secure Port Module (SPM) options: an eight-port GE card and a two-port 10GE card. The 10GE cards do not support aggregate port grouping. A maximum of four GE interfaces or eight FE interfaces can be grouped into an aggregate.
There are limits as to which physical ports can be grouped together. The eight-port GE SPM in the NS5000 has two ASICs for forwarding; the first ASIC supports physical ports 1–4 and the second ASIC supports physical ports 5–8. An aggregate port group cannot span the ASIC boundary, and in this case, that means the group cannot span across the ASIC port definition or, in an NS5400, the slot boundary to another SPM, even if it is of the same type. On the ISG family, there is a single ASIC across the entire firewall, so there is no limitation to port combination other than the fact that there is a maximum of four GE interfaces per aggregate grouping, and it is a best practice that they should be at the same negotiated bandwidth.
Bridge Groups
Bridge Groups are new to ScreenOS starting with version 6.0. on the SSG firewall family. These represent a logical Layer 2 switch within the firewall. You can configure any port on an SSG5/20 into a Bridge Group; on the SSG140/300/500 family, only ports added via Universal Port Interface Modules, uPIMs, can be in a Bridge Group and the group cannot span uPIM modules. This is documented on the Juniper Support Site Knowledge Base within KB article number 10747, located at http://kb.juniper.net/KB10747.
bottom-ssg140->set interface ethernet1/0 zone nullbottom-ssg140->set interface ehternet1/1 zone nullbottom-ssg140->set interface bgroup 1 1bottom-ssg140->set interface bgroup1 port ethernet1/0bottom-ssg140->set interface bgroup1 port ethernet1/1bottom-ssg140->set interface bgroup1 zone untrustbottom-ssg140->set interface bgroup1 ip 64.100.7.1/29bottom-ssg140->get interface bgroup1Interface bgroup1: description bgroup1 number 9, if_info 792, if_index 0, mode route link up, phy-link up/full-duplex vsys Root, zone Untrust, vr trust-vr dhcp client disabled PPPoE disabled admin mtu 0, operating mtu 1500, default mtu 1500*ip 64.100.7.1/29 mac 001b.c046.0909 *manage ip 64.100.7.1, mac 001b.c046.0909route-deny disable pmtu-v4 disabled ping disabled, telnet disabled, SSH disabled, SNMP disabled web disabled, ident-reset disabled, SSL disabled DNS Proxy disabled, webauth disabled, webauth-ip 0.0.0.0 OSPF disabled BGP disabled RIP disabled RIPng disabled mtrace disabled PIM: not configured IGMP not configured NHRP disabled bandwidth: physical 0kbps, configured egress [gbw 0kbps mbw 0kbps] configured ingress mbw 0kbps, current bw 0kbps total allocated gbw 0kbps DHCP-Relay disabled at interface level DHCP-server enabled, status on. Number of SW session: 48063, hw sess err cnt 0Physical port information: ethernet1/0 is up, full duplex, speed is 100mbps ethernet1/1 is up, full duplex, speed is 100mbpsbottom-ssg140->
The naming convention for a Bridge Group is also specific. You must use bgroup and then an integer number as the name or you will get a syntax error. As with previous logical interfaces, the same controls are in place in terms of IP addressing, zone assignment, and such.
Bridge Groups are best used when more than a single physical port is required for connectivity, and only a single IP address is needed or available to define the Layer 3 boundary. An example is a small office where three desktops and a printer are connecting to the Internet. Instead of investing in a switch for connectivity, placing all four ports into a Bridge Group on the SSG firewall with a single Layer 3 IP address reduces operational complexity, removes a single point of failure (the switch), and lowers the cost of the remote office implementation.
Loopback
The loopback interface is a container group that has a couple of primary uses. The first is in a dynamic routing configuration where it would be assigned an IP address that will be used as the Router-ID. Since the loopback interface is always up, the Router-ID remains constant, which makes troubleshooting and configuration more predictable. Another use is in complex NAT configurations. Interfaces in the same security zone can be associated to a loopback-group interface and then that interface can be assigned an IP address and associated NAT definitions to be shared across the underlying interfaces.
Here is an example of creating a loopback-group and associating the underlying interfaces which would be the beginning steps of a NAT configuration:
bottom-ssg140-> bottom-ssg140->set int e0/0 ip 12.18.100.1/29bottom-ssg140->set int e0/1 ip 12.18.101.1/29bottom-ssg140->set interface e0/1 loopback-group loop.1 zone Untrustbottom-ssg140->set int loop.1 ip 12.18.101.5/29 loopback.1 ip change pre-checking failed.Interface: Illegal overlapping subnet bottom-ssg140->set int loop.1 ip 12.18.103.33/27bottom-ssg140->et interface loop.1 description "Outbound dynamic NAT Pool"bottom-ssg140->get int loop.1Interface loopback.1:description Outbound dynamic NAT Poolnumber 126, if_info 127016, if_index 1, mode route link up Loopback interface has 2 members:ethernet0/0; ethernet0/1vsys Root, zone Untrust, vr trust-vr admin mtu 1500, operating mtu 1500, default mtu 1500 *ip 12.18.103.33/27 *manage ip 12.18.103.33 pmtu-v4 disabled ping disabled, telnet disabled, SSH disabled, SNMP disabled web disabled, ident-reset disabled, SSL disabled OSPF disabled BGP disabled RIP disabled RIPng disabled mtrace disabled PIM: not configured IGMP not configured NHRP disabled Number of SW session: 48063, hw sess err cnt 0 bottom-ssg140->
From here, you would go in and create your NAT definitions and then your security policies. Note that the loopback interface definition has some restrictions; it must be in the same security zone as the interfaces associated to it and it cannot be in the same IP address range of any of the associated interfaces. The naming convention for a loopback group is also specific; you must use loop and then an integer number as the name or you will get a syntax error.
Loopback groups seem quite similar to Bridge Groups, but they differ in that each interface associated to a loopback must already have a unique IP address assigned and routing is required to get between those interfaces, whereas the Bridge Group is really like a small logical switch with a unique IP address assigned to the Bridge Group interface.
VLAN
A VLAN interface is a logical subinterface that can be assigned to a physical, a redundant, or an aggregate interface or to a Bridge Group. This is based on the IEEE 802.1q standard, and each ScreenOS platform will have a limitation as to the number of VLANs that can be defined; that limitation will directly correlate to the VLAN subinterface index that can be assigned to any given port. However, ScreenOS does support an 802.1q VLAN tag value in the range of 1–4094, as defined in the standard.
bottom-ssg140->set int red1.150Interface redundant1 index 150, should be <0 - 100> bottom-ssg140->set int red1.80bottom-ssg140->set int red1.80 tag 4091 zone trustbottom-ssg140->set interface red1.80 ip 172.31.55.129/25bottom-ssg140->get interface red1.80Interface redundant1.80: description redundant1.80 number 64, if_info 65152, if_index 80, VLAN tag 4091, mode nat link up, phy-link up/full-duplex Redundant port has 2 members: ethernet0/1; ethernet0/0; Active primary interface: ethernet0/1 Configured primary interface: ethernet0/0 vsys Root, zone Trust, vr trust-vr *ip 172.31.55.129/25 mac 0017.cb30.9705 *manage ip 172.31.55.129, mac 0017.cb30.9705 route-deny disable pmtu-v4 disabled ping enabled, telnet enabled, SSH enabled, SNMP enabled web enabled, ident-reset disabled, SSL enabled DNS Proxy disabled, webauth disabled, webauth-ip 0.0.0.0 OSPF disabled BGP disabled RIP disabled RIPng disabled mtrace disabled PIM: not configured IGMP not configured NHRP disabled DHCP-Relay disabled at interface level DHCP-server disabled Number of SW session: 48063, hw sess err cnt 0 bottom-ssg140->
This is a well-proven function, supported on all platforms, and there are no known limitations with other vendor products on the market.
Tunnel
A tunnel interface is used for route-based virtual private networks (VPNs). The concept here is to create a subinterface that will bind to a security zone for the purpose of defining the security policy boundary. Tunnel interfaces differ from other logical interfaces and subinterfaces in that they do get assigned to a physical (or logical) interface until the IKE gateway is defined. Tunnel interfaces by default do not get assigned IP addresses either, unless there is a requirement to NAT traffic within the IP Security (IPSec) VPN tunnel.
bottom-ssg140->set zone name vpnbottom-ssg140->set interface tun.1 zone vpnbottom-ssg140->set ike gate vpn2corp address 12.1.100.5 outgoing- interface red1 preshare jun1p3rr0x sec-level standardbottom-ssg140->get interface tun.1Interface tunnel.1: description tunnel.1 number 20, if_info 20168, if_index 1, mode route link down vsys Root, zone vpn, vr trust-vr admin mtu 1500, operating mtu 1500, default mtu 1500 *ip 0.0.0.0/0 *manage ip 0.0.0.0 pmtu-v4 disabled ping disabled, telnet disabled, SSH disabled, SNMP disabled web disabled, ident-reset disabled, SSL disabled OSPF disabled BGP disabled RIP disabled RIPng disabled mtrace disabled PIM: not configured IGMP not configured NHRP disabled bandwidth: physical 0kbps, configured egress [gbw 0kbps mbw 0kbps] configured ingress mbw 0kbps, current bw 0kbps total allocated gbw 0kbps Number of SW session: 48063, hw sess err cnt 0 bottom-ssg140->
We discuss IPSec route-based VPNs and the various iterations in detail in Chapter 10.
Summary
Current ScreenOS platforms are very flexible and provide you with a multitude of configuration knobs to turn to provide resiliency, added bandwidth, and connectivity. It is very common to use many of these interface types together to create complex customer configurations.
One last point to note about interfaces is that unlike other security devices, no rules need to be created to permit or deny management access to ScreenOS. This is handled on a per-interface basis, be it physical or logical. Each interface is capable of supporting several access protocols, including SSH, Telnet, HTTP, and HTTPS, as well as management protocols such as PING and SNMP. The specific interface default settings depend on the zone to which they are associated. The Trust zone defaults with all protocols enabled, whereas with the Untrust zone they are all disabled. You can override each setting via the CLI, which we will cover in more detail in Recipe 2.4.
1.2. Troubleshoot ScreenOS
ScreenOS features a rich set of troubleshooting functions that can provide the administrator with a daunting amount of detailed information. Let’s cover a subset of the more useful ones and provide insight into how to fine-tune them to be even more useful. Mainly, the troubleshooting functions are:
Although these four functions can provide vast capabilities, note that your experience will differ depending on your platform. For example, on the high-end ASIC-based platforms (the NS5000 and NS-ISG1000/2000), only the packets that are sent to the MGT card/process can be seen with these tools. The ASIC forwards all other packets, and therefore, you cannot view themusing these tools. Generally speaking, this should not be an issue, as problems usually occur during session setup; however, occasionally the entire flow is needed, at which point an external analyzer may be required. Figure 1-2 illustrates how a packet makes its way through the ScreenOS software.
The debug and snoop functions will setely provide very detailed information that the administrator can use while troubleshooting issues. When used together, these functions can illustrate an entire data flow, starting with what the packet looks like entering the firewall, how ScreenOS processes the packet through the firewall, and finally, what the packet looks like when leaving the firewall.
Debug
The debug tool bag is very deep, and it is one of the most useful troubleshooting functions within ScreenOS because it will show you what ScreenOS is doing with the packet as it makes its way through the different ScreenOS processes and functions (shown in Figure 1-2). For example:
	top-ssg140-> debug ?
	admin                debug admin
	adsl                 adsl debugging
	anti-spam            anti-spam debugging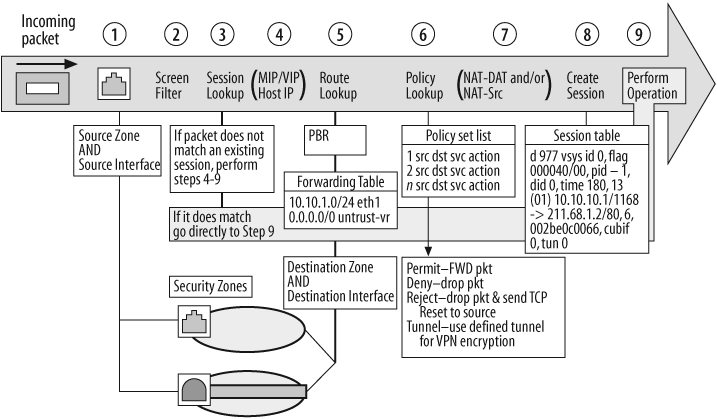
	apppry                 Application Proxy debugging
	arp                    arp debugging
	asp                    ASP debugging
	asset-recovery         asset recovery debugging
	auth                   user authentication debugging
	autocfg                Auto config debugging
	av                     anti virus scan debugging
	bgp                    bgp debugging
	bgroup                 bgroup debugging
	cav                    cavium debugging
	cluster                command propagated to cluster members
	cpu-limit              CPU limit debugging
	dhcp                   debug dhcp
	dhcp6                  dhcpv6 debugging
	dialer                 dialer debugging
	dip                    dip debugging
	dlog                   dlog debugging
	dns                    dns debugging
	dot1x                  IEEE802.1X debug
	driver                 driver debugging
	emweb                  EmWeb debugging
	filesys                Filesys debugging
	fips                   fips debugging
	flash                  flash operating debugging
	flow                   Flow level debugging
	flow-tunnel            Flow Tunnel debugging
	fr                     Frame-Relay debugging
	fs                     file system debugging
	gc                     gc receive and transmit debug
	gdb                    GDB debugging
	global-pro             global-pro debugging
	gt                     generic tunnel debugging
	gtmac                  gtmac debug
	h323                   h323 debugging
	hdlc                   HDLC debugging
	httpfx                 http-fx debugging
	icap                   ICAP debugging
	icmp                   icmp debugging
	idp                    set idp debug parameters
	ids                    ids debugging
	igmp                   igmp debugging
	ike                    ike debugging
	interface              interface debugging
	intfe                  Intfe debugging
	ip                     ip debugging
	ipacx                  isdn ipacx driver debugging
	ipv6                   ipv6 debugging
	isdn                   isdn debugging
	ixf                    ixf debug
	ixp23xxdrv             ixp23xx driver debugging
	l2tp                   L2TP debugging
	lance                  Lance debugging
	ldap                   ldap debug menu
	logging                logging debugging
	memory                 Memory debugging
	mgcp                   mgcp debugging
	midwayipacx            isdn ipacx driver debugging
	mip                    mip debugging
	ml                     Multilink debugging
	modem                  Moden debugging
	nas                    nas debugging
	nasa                   nasa debugging
	nat                    nat debugging
	ndp                    ndp debugging
	netif                  netif debugging
	nhrp                   nhrp debugging
	npak                   npak debugging
	nrtp                   Reliable Xfer Protocol debugging
	nsgp                   debug nsgp
	nsmgmt                 debug nsmgmt
	nsp                    NSM NSP message content
	nsrd                   NSRD debugging
	nsrp                   debug nsrp
	obj-id                 obj id debugging
	ospf                   ospf debugging
	pbr                    policy-based routing debugging
	pccard                 Pccard debugging
	pim                    pim debugging
	pki                    pki debug menu
	pluto                  Pluto debugging
	policy                 policy debugging
	portnum                portnum debugging
	ppcdrv                 driver debugging
	ppp                    ppp debugging
	pppoa                  pppoa debugging
	pppoe                  pppoe debugging
	proxy                  tcp proxy debugging
	rd                     rd debug info
	registry               system events registry debugging
	report                 report debugging
	rip                    rip debugging
	ripng                  ripng debugging
	rm                     rm debugging
	rms                    rms debug info
	rpc                    rpc debugging
	rs                     rs debug info
	rtsync                 route-synchronization debugging
	sa-mon                 sa monitor debugging
	sccp                   sccp debugging
	script                 script debugging
	sctp                   gprs sctp debugging
	sendmail               sendmail debugging
	session                session debugging
	shaper                 debug shaper
	shdsl                  G.SHDSL debug
	sip                    sip debugging
	snmp                   snmpnew debugging
	socket                 socket debug
	ssh                    debug ssh
	ssl                    ssl debugging
	stflow                 saturn flow debug info
	sw-key                 software key debugging
	syslog                 syslog debugging
	tag                    tag info
	task                   Task debugging
	tcp                    tcp debug
	telnet                 debug telnet
	time                   device clock time debugging
	timer                  Timer debugging
	trackip                debug trackip
	traffic                traffic control debugging
	udp                    udp debugging
	uf                     UF debugging
	url-blk                url filtering debugging
	usb                    usb debugging
	user                   user/group database debugging
	vip                    vip debugging
	vr                     virtual router debugging
	vrrp                   vrrp debugging
	vsys                   vsys debugging
	vwire                  VWIRE debugging
	web                    WebUI debugging
	webtrends              webtrends debugging
	wlan                   wlan debugging
	zone                   zone debugging
	top-ssg140->
You can debug just about any function, and the amount of information can be stag-gering, so be careful what you ask for. Although it is beyond the scope of this book to detail each debug function, each chapter and recipe in this book may utilize debug to some extent. The most commonly used debug function is debug flow. Here are the specific flow options:
	top-ssg140-> debug flow
	all                  all flow debug
	basic                basic debug
	drop                 drop pak debug
	dynpol               dynamic policy search debug
	illegal              illegal debug
	internal             internal debug
	mcast                flow multicast debug
	mgt                  mgt debug
	mpak                 mp pak message debug
	mpdiff               mp diff message debug
	mperr                mp message error debug
	mpgate               mp gate message debug
	mpmvpn               mng over vpn message debug
	mpsess               mp session message debug
	mpvpn                mp vpn message debug
	pak-poll             packet polling debug
	profiling            flow profiling
	self                 self debug
	session              session debug
	sm-skip              No pak passing to SM
	spinlock             spinlock
	tcp-sequence-check   tcp sequence check debug
	tiny-tcp             tiny tcp debug
	vlan                 vlan debug
Warning
Debug functions are very CPU-intensive, and best practice dictates that you enable them only when you require active data capture.
You can verify whether debug is currently enabled with get debug. You can disable debug by either pressing the Esc key or entering an undebug command:
top-ssg140->get debugflow: basic top-ssg140-><Esc>All debug off top-ssg140->get debugtop-ssg140-> top-ssg140->debug flow basictop-ssg140->get debugflow: basic top-ssg140->undebug flowtop-ssg140->get debugtop-ssg140->
Flow Filter
Although debug is intended to capture detailed information, rarely is a single flow going through the firewall at any given time. Therefore, it is important to be able to restrict the information gathered by debug to ensure that the buffer or CPU is not overloaded, or that other extraneous data is not captured as well, thus confusing the data we need. This is where flow filters come into play:
	top-ssg140-> set ffilter ?
	<return>
	dst-ip               flow filter dst ip
	dst-port             flow filter dst port
	ip-proto             flow filter ip proto
	src-ip               flow filter src ip
	src-port             flow filter src port
	top-ssg140->
Flow filters can be simple or complex. They can also be constructed with “or” or “and” logic. Flow-filter options specified in the same command (on the same line) will be “ANDed” together, which means that all the filters specified need to be matched to qualify. For example, if the data required was for a single flow and the source and destination addresses as well as the destination port are known, a flow filter such as the following would be constructed:
bottom-ssg140->set ffilter src-ip 10.251.7.113 dst-ip 10.10.10.1 ip-proto 1filter added bottom-ssg140->get ffilterFlow filter based on: id:0 src ip 10.251.7.113 dst ip 10.10.10.1 ip proto 1 bottom-ssg140->
This flow filter will capture all traffic sourced only from10.251.7.113, and destined to 10.10.10.1 and IP protocol 1, the Internet Control Message Protocol (ICMP).
Flow-filter options specified on separate lines are “ORed” together, which means that a match of any of the filters specified will qualify. For example, if some portion of the flow is unknown, or if all data to a specific host on a variety of ports is to be captured, the following would be constructed:
bottom-ssg140->set ffilter dst-ip 10.10.10.1 ip-proto 6 dst-port 22filter added bottom-ssg140->set ffilter dst-ip 10.10.10.1 ip-proto 6 dst-port 23filter added bottom-ssg140->get ffilterFlow filter based on: id:0 src ip 10.251.7.113 dst ip 10.10.10.1 ip proto 1id:1 dst ip 10.10.10.1 ip proto 6 dst port 22 id:2 dst ip 10.10.10.1 ip proto 6 dst port 23bottom-ssg140->
This set of flow filters will capture the data as described earlier; or traffic sourced from any host and destined to 10.10.10.1 and IP protocol 6, TCP, and destination port 22, SSH; or traffic sourced from any host and destined to 10.10.10.1 and IP protocol 6, TCP, and destination port 23, Telnet.
Often it is desired to capture data to (dst) or from(src) a particular host. You can do this on two sete lines:
bottom-ssg140->set ffilter dst-ip 10.251.7.97filter added bottom-ssg140->set ffilter src-ip 10.251.7.97filter added bottom-ssg140->get ffilterFlow filter based on: id:0 src ip 10.251.7.113 dst ip 10.10.10.1 ip proto 1 id:1 dst ip 10.10.10.1 ip proto 6 dst port 22 id:2 dst ip 10.10.10.1 ip proto 6 dst port 23id:3 dst ip 10.251.7.97 id:4 src ip 10.251.7.97bottom-ssg140->
This set of flow filters will filter the data destined to or sourced fromthe 10.251.7.97 host.
To manage the flow filters, you assign each one an identification number starting with 0, using the nomenclature id:n. The administrator can delete an individual flow filter by specifying it in the command or the flow filter with id:0, which is the default behavior when no flow filter ID is specified:
bottom-ssg140->unset ffilter 1 filter 1 removedbottom-ssg140->get ffilterFlow filter based on: id:0 src ip 10.251.7.113 dst ip 10.10.10.1 ip proto 1 id:1 dst ip 10.10.10.1 ip proto 6 dst port 23 id:2 dst ip 10.251.7.97 id:3 src ip 10.251.7.97 bottom-ssg140->unset ffilter filter 0 removedbottom-ssg140->get ffFlow filter based on: id:0 dst ip 10.10.10.1 ip proto 6 dst port 23 id:1 dst ip 10.251.7.97 id:2 src ip 10.251.7.97
Debug Buffer
The debug buffer (dbuf or db) is the local buffer of memory on the firewall for trou-bleshooting tools in which to write output. It is possible to dump this data to the console screen, but that is unwise as it may lead to overrunning the console and being unable to break into the flow to stop it and regain console access. You can see the actual size of the debug buffer in bytes by issuing the get sys-cfg or get db info command:
bottom-ssg140->get db infocount: 9816, last index: 9816, cur index: 0, size: 131072 start: 0, pause: 0 bottom-ssg140->get sys-cfg | inc dbufdbuf number: 131072
You can increase this via the CLI. However, you must be careful to ensure that enough resources are available on the system:
bottom-ssg140->set db size<number> size in kilobytes of debug buffer[from 32 to 4096] bottom-ssg140->get memMemory: allocated46520432, left 235763184, frag 8, fail 0 bottom-ssg140->set db size 256bottom-ssg140->get db infocount: 9816, last index: 9816, cur index: 0, size: 262144 start: 0, pause: 0 bottom-ssg140->get memMemory: allocated46651488, left 235632128, frag 9, fail 0 bottom-ssg140->
In the preceding code, we have increased the buffer size fromthe default of 128 KB to 256 KB. Note that this decreased the available memory by 128 KB; remember that ScreenOS is a real-time operating system. The SSG140 platform will accept a debug buffer size of up to 4 MB.
It is a good idea to clear the debug buffer, with clear dbuf, before each debug session to ensure that the buffer will capture the data intended based on the flow-filter settings and time of capture. The following is some example output of the most common option, debugflow basic:
	top-ssg140-> get dbuf stream
	****** 88482.0: <Trust/eth0/0> packet received [60]******
	/*Packet received
	  ipid = 53693(d1bd), @d7812070
	/*Create fingerprint for packet/session
	  eth0/0:10.251.7.113/2816->20.20.20.2/512,1(8/0)
	/*Describe packet, src/dst IP, etc
	  IP classification from non-shared src if : vsys none
	/*Determine if part of a VSYS
	  search route to 20.20.20.2 in vr trust-vr for 0/0
	/*Perform route lookup
	  route 20.20.20.2->20.20.20.2, to eth0/1
	/*Describe route
	  routed 20.20.20.2 from eth0/0 (eth0/0 in 0) to eth0/1
	/*Route packet
	  pak loopback to zone Trust
	/*Describe filter set (trust-trust in this case)
	  vsd 0 is active
	/*Describe redundancy status
	  policy id = 13(Permit), tunnel = 0
	/*Which policy matches, which tunnel (13, none)
	  Session created for first pack,
	/*Create session
	  find matched sess id:4722
	/*Describe SessionID
	  core pak
	/*Send to forwarding engine
	  vsd 0 is active
	/*Verify redundancy status
	  flow_ip_send: d1bd:10.251.7.113->20.20.20.2,1 => eth0/1(60)
	/*Queue packet
	  no mac in session
	/*Look up MAC address
	  arp entry found for 20.20.20.2
	/*Find MAC
	  Send to eth0/1 (74)
	/*Send packet
	****** 88482.0: <Trust/ethernet7> packet received [60]******
	/*Packet received
	  ipid = 43579(aa3b), @d78c3070
	/*Create fingerprint
	  eth0/1:20.20.20.2/512->10.251.7.113/2816,1(0/0)
	/*Describe packet, src/dst IP, etc
	  find matched sess id:4722
	/*Find session from above
	  core pak
	/*Send to forwarding engine
	  vsd 0 is active
	/*Verify redundancy status
	  flow_ip_send: aa3b:20.20.20.2->10.251.7.113,1 => eth0/0(60)
	  @d78c3070
	/*Queue packet
	  mac 0010db13cbd0 in session
	/*No MAC lookup necessary, in session from request
	  Send to eth0/0 (74)
	/*Send packet
	top-ssg140->
You can display the output to the console or redirect it to a TFTP server with the following:
	bottom-ssg140-> get db stream > tftp 10.251.7.113 login_debug.txt
	redirect to 10.251.7.113,login_debug.txt
	!!!!!!!!!!!!!!!!!!!!!!!!!!!!!!!!!!!!!!!!!!!!!!!!!!!!!!!!!!!!!!!!!!!!!
	!!!!!!!!!!!!!!!!!!!!!!!!!!!!!!!!!!!!!!!!!!!!!!!!!!!!!!!!!!!!!!!!!!!!!
	!!!!!!!!!!!!!!!!!!!!!!!!!!

	...

	!!!!!!!!!!!!!!!!!!!!!!!!!!!!!!!!!!!!!!!!!!!!!!!!!!!!!!!!!!!!!!!!!!!!!
	!!!!!!!!!!!!!!!!!!!!!!!!
	tftp transferred records = 378
	tftp success!
	bottom-ssg140->
Snoop
Another useful tool is snoop. Snoop differs from the debug tool in that snoop’s primary function is to show what the packet looks like on the wire when it enters or leaves an interface, similar to an external sniffer, but minus the payload. You can view Layer 1–4 information as well as up to 1,514 bytes of hex data. Often, snoop will be used to validate that the device is receiving or sending a packet when debug flow isn’t providing an expected output. You can then apply filtering to tune what is captured, as shown here:
bottom-ssg140->snoop infoSnoop:OFFFilters Defined: 0, Active Filters 0 Detail:OFF, Detail Display length: 96
Snoop does not use flow filters, but it does allow a different filter system that is similar in structure to tcpdump. For example, the following filter will capture traffic between hosts 10.251.7.113 and 10.10.10.1 on port 23:
bottom-ssg140->snoop filter ip src-ip 10.251.7.113 dst-port 23snoop filter added bottom-ssg140->snoop filter ip src-ip 10.10.10.1 src-port 23snoop filter added bottom-ssg140->snoop infoSnoop: OFF Filters Defined:2, Active Filters2Detail: OFF, Detail Display length: 1 Snoop filter based on:id 1(on): IP src-ip 10.251.7.113 dst-port 23 dir(B) id 2(on): IP src-ip 10.10.10.1 src-port 23 dir(B)bottom-ssg140->
Just like with debug, it is good to clear the debug buffer before enabling snoop:
bottom-ssg140->clear dbufbottom-ssg140->snoopStart Snoop, type ESC or 'snoop off' to stop, continue? [y]/nybottom-ssg140-> bottom-ssg140->get dbuf stream32616.0: ethernet0/0(i) len=62:00166f027720->0017cb479400/0800 10.251.7.113 -> 10.10.10.1/6 vhl=45, tos=00, id=45238, frag=0000, ttl=128 tlen=48 tcp:ports 4646->23, seq=6684683, ack=0, flag=7002/SYN 32616.0: ethernet0/2(o) len=62:0017cb479406->0017cb478d06/0800 10.251.7.113 -> 10.10.10.1/6 vhl=45, tos=00, id=45238, frag=0000, ttl=127 tlen=48 tcp:ports 4646->23, seq=6684683, ack=0, flag=7002/SYN
Here is the initial TCP SYN packet, from 10.251.7.113 coming inbound, (i), on inter-face ethernet0/0, being sent outbound, (o), on ethernet0/2:
	32616.0: ethernet0/2(i) len=62:0017cb478d06->0017cb479406/0800
	   10.10.10.1 -> 10.251.7.113/6
	   vhl=45, tos=00, id=1434, frag=0000, ttl=64 tlen=44
	   tcp:ports 23->4646, seq=1569021109, ack=6684684, flag=6012/SYN/ACK

	32616.0: ethernet0/0(o) len=58:0017cb479400->00166f027720/0800
	   10.10.10.1 -> 10.251.7.113/6
	   vhl=45, tos=00, id=1434, frag=0000, ttl=63 tlen=44
	   tcp:ports 23->4646, seq=1569021109, ack=6684684, flag=6012/SYN/ACK
Here is the TCP SYN/ACK sequence acknowledging the SYN and sending its own SYN segment coming inbound, (i),on ethernet0/2 and then being sent outbound, (o), on ethernet0/0:
	32872.0: ethernet0/0(i) len=60:00166f027720->0017cb479400/0800
	   10.251.7.113 -> 10.10.10.1/6
	   vhl=45, tos=00, id=46850, frag=0000, ttl=128 tlen=40
	   tcp:ports 4646->23, seq=6684723, ack=1569021177, flag=5011/FIN/ACK

	32872.0: ethernet0/2(o) len=54:0017cb479406->0017cb478d06/0800
	   10.251.7.113 -> 10.10.10.1/6
	   vhl=45, tos=00, id=46850, frag=0000, ttl=127 tlen=40
	   tcp:ports 4646->23, seq=6684723, ack=1569021177, flag=5011/FIN/ACK
Last is the TCP ACK to complete the TCP three-way handshake and move the session from an embryonic state to a full connection state. ScreenOS has an internal timer of 20 seconds to complete the three-way handshake or delete the embryonic session from the state table.
	32872.0: ethernet0/0(i) len=60:00166f027720->0017cb479400/0800
	   10.251.7.113 -> 10.10.10.1/6
	   vhl=45, tos=00, id=46850, frag=0000, ttl=128 tlen=40
	   tcp:ports 4646->23, seq=6684723, ack=1569021177, flag=5011/FIN/ACK

	32872.0: ethernet0/2(o) len=54:0017cb479406->0017cb478d06/0800
	   10.251.7.113 -> 10.10.10.1/6
	   vhl=45, tos=00, id=46850, frag=0000, ttl=127 tlen=40
	   tcp:ports 4646->23, seq=6684723, ack=1569021177, flag=5011/FIN/ACK
The starting TCP FIN/ACK sequence acknowledging the last packet received and start-ing the FIN process looks like this:
	32872.0: ethernet0/2(i) len=60:0017cb478d06->0017cb479406/0800
	   10.10.10.1 -> 10.251.7.113/6
	   vhl=45, tos=00, id=1439, frag=0000, ttl=64 tlen=40
	   tcp:ports 23->4646, seq=1569021177, ack=6684724, flag=5019/FIN/ACK

	32872.0: ethernet0/0(o) len=54:0017cb479400->00166f027720/0800
	   10.10.10.1 -> 10.251.7.113/6
	   vhl=45, tos=00, id=1439, frag=0000, ttl=63 tlen=40
	   tcp:ports 23->4646, seq=1569021177, ack=6684724, flag=5019/FIN/ACK
Then, the TCP FIN/ACK packet coming from the other host acknowledges the FIN and sends its own:
	32872.0: ethernet0/0(i) len=60:00166f027720->0017cb479400/0800
	   10.251.7.113 -> 10.10.10.1/6
	   vhl=45, tos=00, id=46851, frag=0000, ttl=128 tlen=40
	   tcp:ports 4646->23, seq=6684724, ack=1569021178, flag=5010/ACK

	32872.0: ethernet0/2(o) len=54:0017cb479406->0017cb478d06/0800
	   10.251.7.113 -> 10.10.10.1/6
	   vhl=45, tos=00, id=46851, frag=0000, ttl=127 tlen=40
	   tcp:ports 4646->23, seq=6684724, ack=1569021178, flag=5010/ACK
Finally, the last TCP ACK packet is received, acknowledging the FIN and closing out the TCP session (this is with default settings on snoop, which shows the entire IP and TCP header information—essential when troubleshooting and you need to know what a packet looked like when entering and leaving the firewall).
Get ScreenOS Cookbook now with the O’Reilly learning platform.
O’Reilly members experience books, live events, courses curated by job role, and more from O’Reilly and nearly 200 top publishers.

