Now let's see whether the job titles have any correlation with the subscription decision:
%sql select job,y, count(1) from trainData group by job, y order by job, y
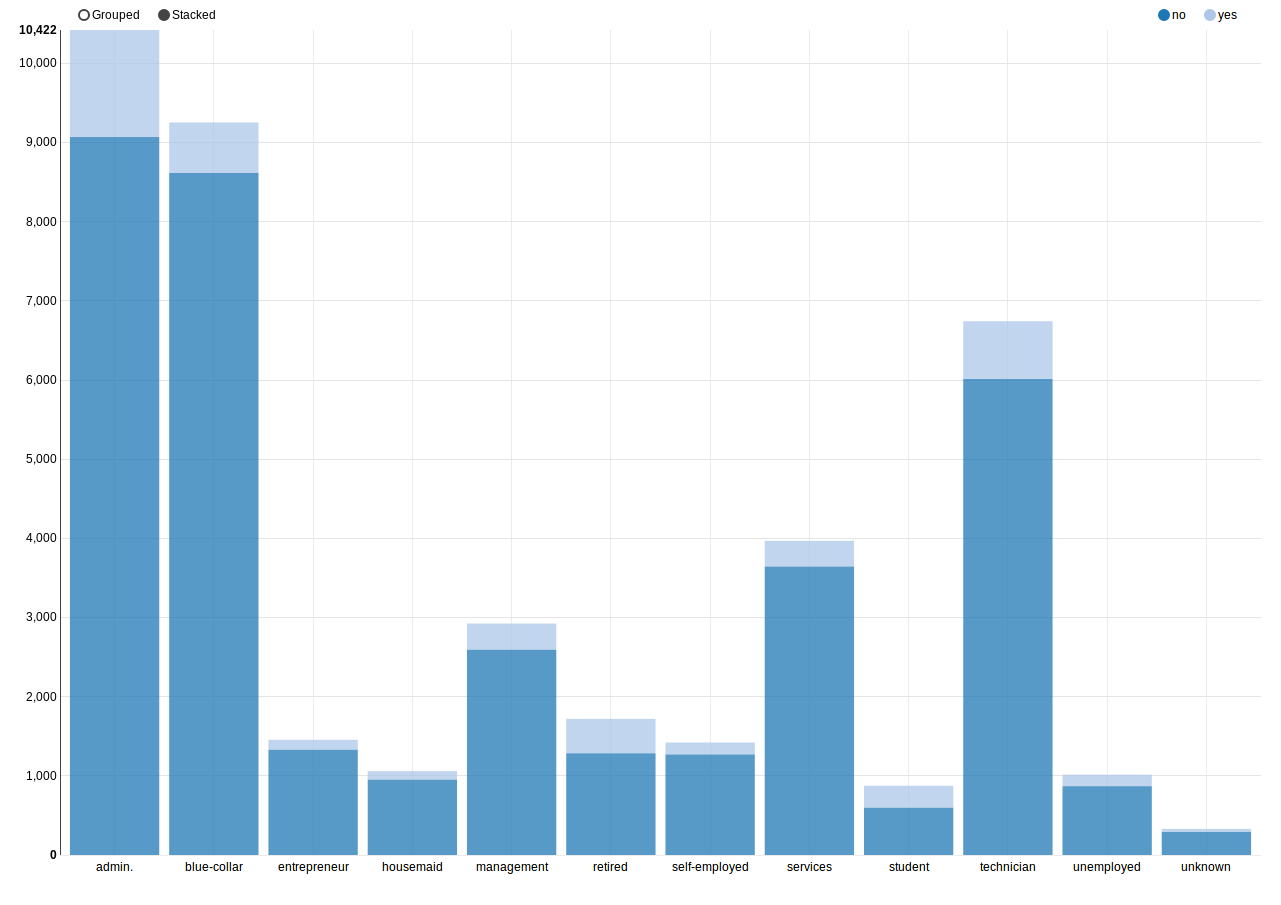
From the chart we can see that most of the clients have jobs as admin, blue-collar, or technician, while students and retired clients have the biggest count(y) / count (n) ratio.

