Creating a time series MultiPlot with Bokeh-Scala
In this second recipe on plotting using Bokeh, we'll see how to plot a time series graph with a dataset borrowed from https://archive.ics.uci.edu/ml/datasets/Dow+Jones+Index. We will also see how to plot multiple charts in a single document.
How to do it...
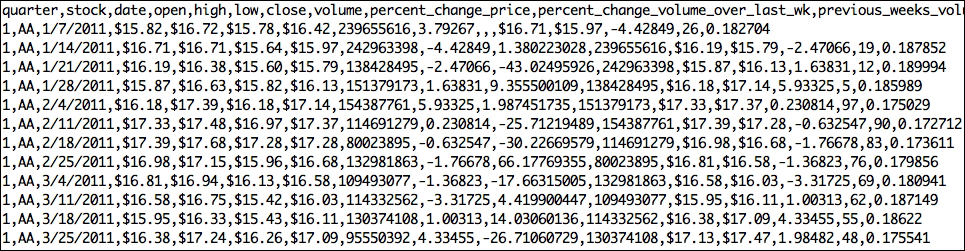
We'll be using only two fields from the dataset: the closing price of the stock at the end of the week, and the last business day of the week. Our dataset is comma separated. Let's take a look at some samples, as shown here:
Preparing our data
In contrast to the previous recipe, where we used the Breeze matrix to construct the Bokeh ColumnDataSource ...
Get Scala Data Analysis Cookbook now with the O’Reilly learning platform.
O’Reilly members experience books, live events, courses curated by job role, and more from O’Reilly and nearly 200 top publishers.

