Section 1
CHOOSING CHARTS
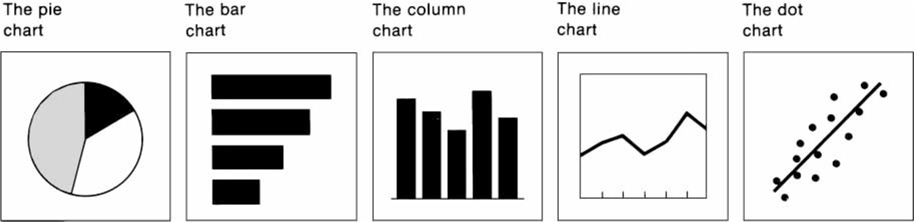
No matter how many business graphics we see in various kinds of communications—including tables, organization charts, flow diagrams, matrixes, maps—when it comes to quantitative charts, there are only five basic chart forms to choose from. As shown here in simple terms, these are:
Now we know where we’re going; the question is, how do we get there? With the following diagram, let me summarize the process that moves us from the data we start with to the specific chart we end with.
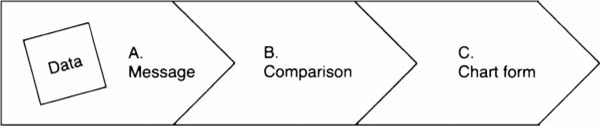
Step A:
DETERMINE YOUR MESSAGE
(from data ...
Get Say It With Charts: The Executive’s Guide to Visual Communication, 4th Edition now with the O’Reilly learning platform.
O’Reilly members experience books, live events, courses curated by job role, and more from O’Reilly and nearly 200 top publishers.

