EXAMPLE 14 Sparkline Table
Purpose: Create a table of custom sparklines.
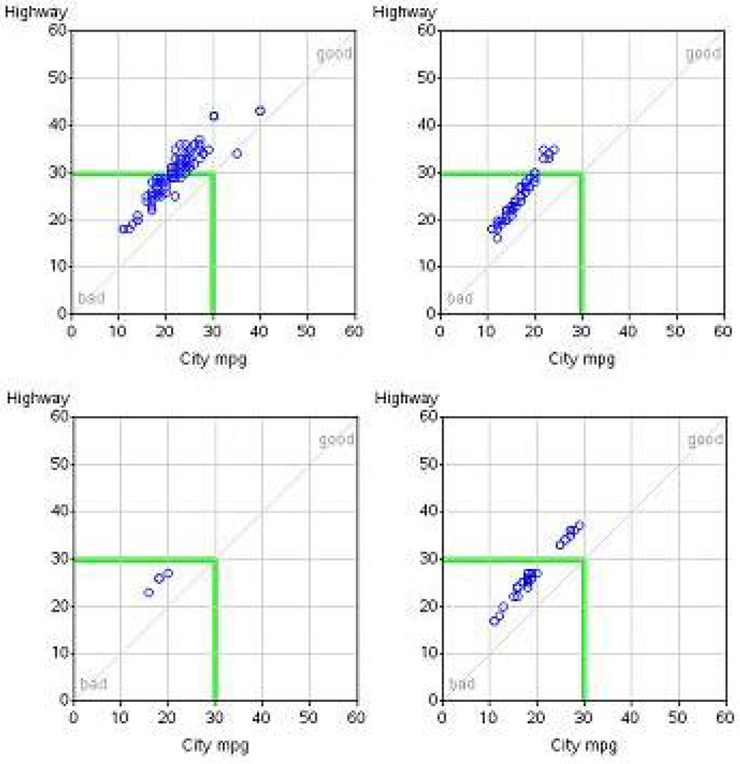
When you are analyzing and comparing lots of data, it is often useful to see several plots on the same page. Sometimes you might use small multiples, rows and columns of graphs, paneled displays, or even dashboard layouts. For example, here is a multi-graph display from Example 3, âPaneling Multiple Graphs on a Page.â
But when you want to pack the maximum number of line charts into the smallest possible space, you will probably want to use sparklines. Here is a small sparkline example:
There is not a built-in procedure option to create sparklines using PROC GPLOT, ...

