The Designer
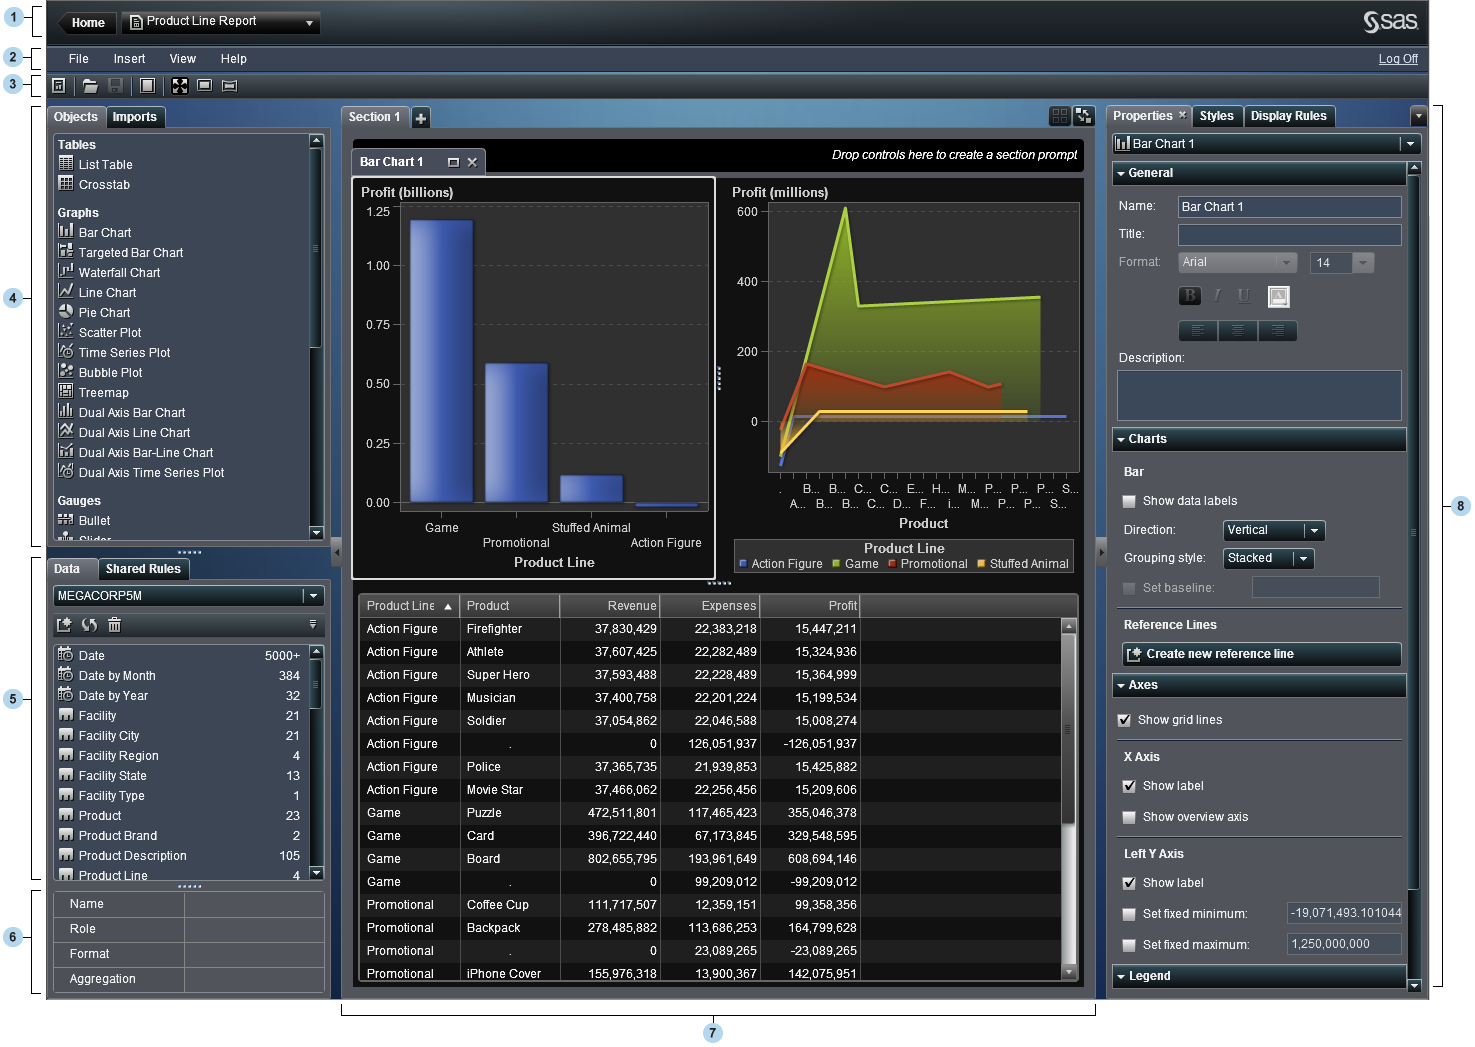
| 1 | The application bar provides access to the home page and recent objects. |
| 2 | The menu bar offers common tasks for the current report or section. |
| 3 | The toolbar enables you to expand the workspace and change a report’s canvas size. |
| 4 | The Objects tab enables you to add new report objects. The Imports tab enables you to import and reuse content from other reports. |
| 5 | The Data tab
enables you to select data. You can add, refresh, or remove a data
source using the icons above the list of data items. Using the local
menu ( |
Get SAS Visual Analytics 6.1: Getting Started with Exploration and Reporting now with the O’Reilly learning platform.
O’Reilly members experience books, live events, courses curated by job role, and more from O’Reilly and nearly 200 top publishers.

