Let's now discuss plotting the survival curve.
PROC LIFETEST has been used to analyze the survival plot and observe the percentage of the population that has censored data. The procedure produces a graph of the Kaplan-Meier estimator of the survival function.
Here is the code for a non-parametric procedure survival chart:
PROC LIFETEST Data=Survival_Analysis Plots=survival;
   Time tenure*censor(1);
Run;
The CDF plot in Figure 6.5 is quite similar to the survival plot in Figure 6.7. The survival function, S(t) is derived after subtraction of the CDF from 1:
S(t) = 1 - CDF
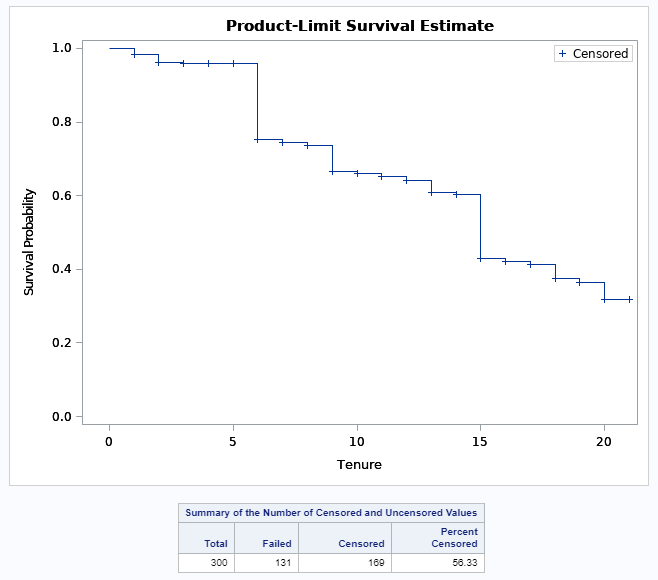
Figure 6.7: Survival plot using non-parametric ...

