We can now use the forecasts from the regression model and ARIMA and compare this against the observed values from our handout sample. As you can see, the ARIMA model forecasts are closer to the observed values. The regression forecasts tend to perform better during the latter part of the handout's observed values. Just a glance at the chart will surely lead to the decision of going with the regression methodology. But is the decision that simple?
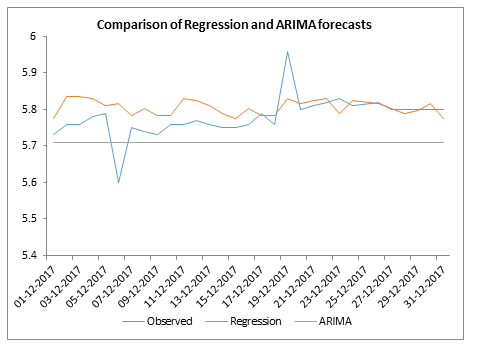
Figure 2.28: Model comparison
Remember, our modeler has $10 million to invest. What if he invested 10% of it in this mobile manufacturer's stock, based on the closing price of ...

