Working with the Line chart
There are many chart types we can use when we are creating Web Intelligence reports, but we would like to get a better understanding of which chart type we can use and when.
Getting ready
We will be analyzing the sales revenue by year in a graphical way that will display the sales trend.
How to do it...
We will first open the Available Objects panel on the left-hand side and perform the following steps:
- From the Available Objects pane, we will drag-and-drop the Sales revenue and Year objects into the report area, as shown in the following screenshot:
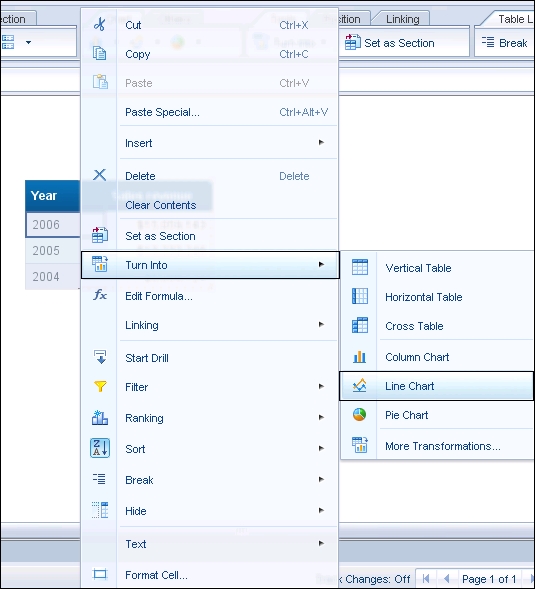
- After the table is located in the report area, we will right-click on the ...
Get SAP BusinessObjects Reporting Cookbook now with the O’Reilly learning platform.
O’Reilly members experience books, live events, courses curated by job role, and more from O’Reilly and nearly 200 top publishers.

