Working with cross tables
Pivot tables are matrix tables aimed to slice a measure with two or more dimensions.
Pivot tables are great for presenting aggregative data, but provide additional value for the data analysis as they use the x and y axes. This enables us to cross the data and compare two dimensions or more.
Getting ready
In order to understand the pivot table capabilities, we will use a basic structure: two dimensions and one measure object.
How to do it...
In the following pivot table, we will be able to analyze data by the Year or Quarter dimension. In the pivot body table, the revenue measure is presented as follows:
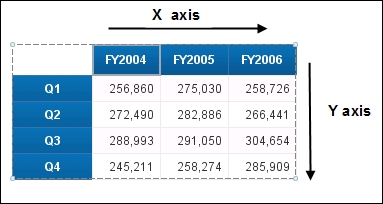
We can analyze each quarter ...
Get SAP BusinessObjects Reporting Cookbook now with the O’Reilly learning platform.
O’Reilly members experience books, live events, courses curated by job role, and more from O’Reilly and nearly 200 top publishers.

