Analyzing trends
With the trend analyzer component dashboard design is able to calculate trends in a series of data. You can display these trends in a chart so you can view them next to the actual data and make your analysis. This component is also able to forecast future trends based on the actual data.
Getting ready
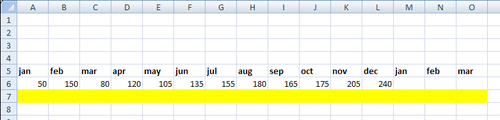
For this recipe we need some data, so open a new Dashboard Design file and enter the values in the spreadsheet as shown in the following screenshot:
How to do it...
- Drag a combination chart component into the canvas.
- Bind the data By Range to spreadsheet cells A5 through O7.
- Drag a trend analyzer component into the canvas.
- Bind the ...
Get SAP BusinessObjects Dashboards 4.0 Cookbook now with the O’Reilly learning platform.
O’Reilly members experience books, live events, courses curated by job role, and more from O’Reilly and nearly 200 top publishers.

