Switching between different charts
This recipe will show you how to create a dashboard with the possibility to switch between two charts.
Getting ready
Open a new Dashboard Design file and drag two different chart components (for example, a line chart and a pie chart component) to the empty canvas. Drag the label-based menu component to the canvas, as well.
How to do it...
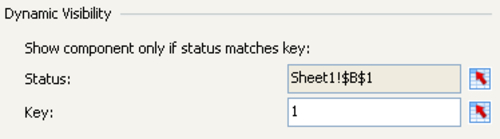
- Click on the line chart component and go to the Behavior tab of its properties pane. At the bottom of the pane, you will see a section called Dynamic Visibility.
- Bind the Status field to spreadsheet cell B1.
- Put the value 1 in the Key field.
- Click on the pie chart component and ...
Get SAP BusinessObjects Dashboards 4.0 Cookbook now with the O’Reilly learning platform.
O’Reilly members experience books, live events, courses curated by job role, and more from O’Reilly and nearly 200 top publishers.

