Using Filtered Rows
Filtered Rows was one of the greatest additions to Xcelsius 2008 (now SAP BusinessObjects Dashboards 4.0) from Xcelsius 4.5. If we look at the following figure, we have a set of Sales metrics that are grouped by Region and Office:
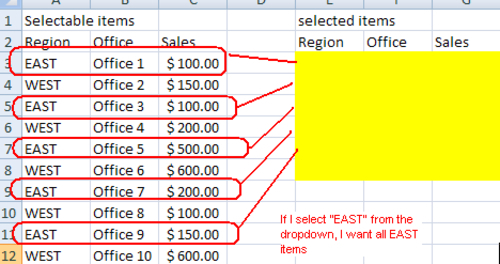
Let's say I wanted to be able to select a region and show a sales comparison chart between the different sales offices of that region. Before the advent of Filtered Rows, we would have to perform complex VLOOKUPs or have the result come back through a query every time a region is selected, which is very time consuming.
How to do it...
- We will use a Combo Box selector to choose the desired region.
Get SAP BusinessObjects Dashboards 4.0 Cookbook now with the O’Reilly learning platform.
O’Reilly members experience books, live events, courses curated by job role, and more from O’Reilly and nearly 200 top publishers.

