Displaying raw data
If you want to display numbers and text, and not by a chart, but just in a table, you can use the spreadsheet table component.
Getting ready
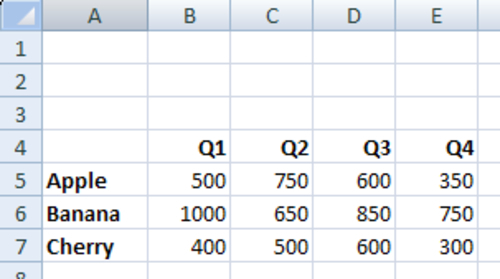
Open a new Dashboard Design file and enter the data into the spreadsheet, as shown in the following screenshot:
How to do it...
- In the spreadsheet, select cells A4 through E4.
- Add a Bottom Border by using the Borders menu of the Font section of the Home tab in the spreadsheet.
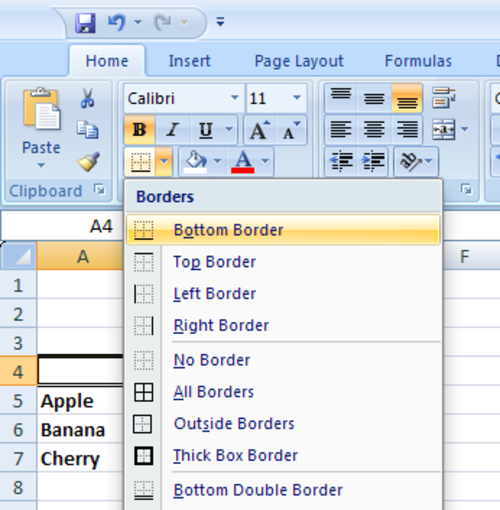
- Select cells A4 through A7 and add a Right Border.
- Drag a Spreadsheet Table component into the canvas.
- Bind the Display ...
Get SAP BusinessObjects Dashboards 4.0 Cookbook now with the O’Reilly learning platform.
O’Reilly members experience books, live events, courses curated by job role, and more from O’Reilly and nearly 200 top publishers.

