Using the combination chart
With the combination chart you are able to use both columns and lines to visualize data in one single chart.
Getting ready
Open a new Dashboard Design file and enter the data into the spreadsheet as shown in the following screenshot:
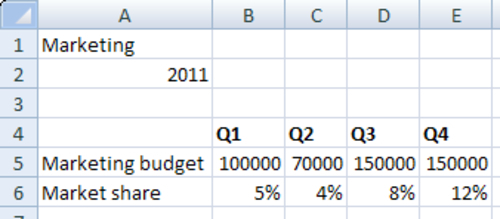
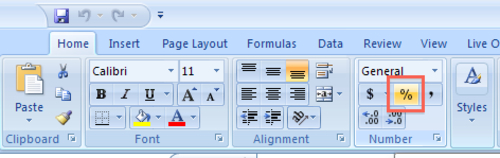
Use the Percent Style option to convert the market share values into percentages. You can find this option in the Number section of the Home tab of the toolbar.
How to do it...
- Drag a Combination Chart component to the canvas.
- Bind the Chart field to cell A1 and the Subtitle field to cell B2. ...
Get SAP BusinessObjects Dashboards 4.0 Cookbook now with the O’Reilly learning platform.
O’Reilly members experience books, live events, courses curated by job role, and more from O’Reilly and nearly 200 top publishers.

