Making the spreadsheet more readable with colors
To make clear what the exact purpose of a cell is we need a set of guidelines to follow.
Getting ready
You need a basic Dashboard Design dashboard containing a few components in the canvas with some bindings to the data model in the spreadsheet.
How to do it...
- Go to your data model in the spreadsheet.
- Select the cell(s) you want to color.
- Click on the Fill Color button and select the desired color. You can find this button in the Font section of the Home tab.
- Color the cells that have dynamic visibility values in orange.
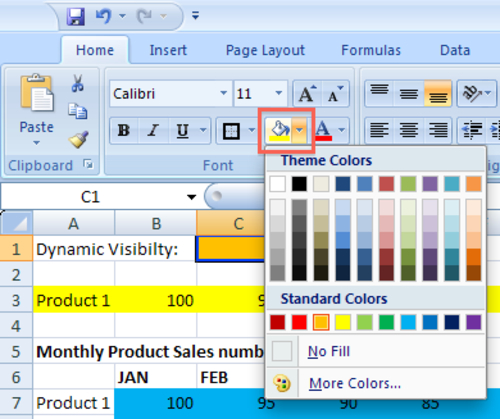
- Color the cells with input values from canvas components yellow. In the following ...
Get SAP BusinessObjects Dashboards 4.0 Cookbook now with the O’Reilly learning platform.
O’Reilly members experience books, live events, courses curated by job role, and more from O’Reilly and nearly 200 top publishers.

