Sales/profit dashboard example
In this example, we will utilize many techniques that we have learned in the previous recipes to create a Sales Profit dashboard.
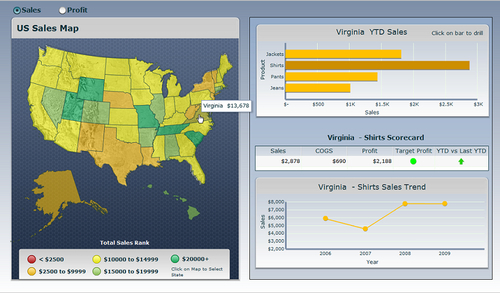
The Sales Profit dashboard displays the sales or profit of each state on the map. From the map, a user can then select a state and then view year to date sales/profit information for products that are sold on the top right. The user can then drill down further by clicking on a product. A detailed scorecard and trend chart will then be shown for the selected state and product.
Techniques from the following chapters and recipes were used to accomplish the example:
- Chapter 1,
- Adding a line chart ...
Get SAP BusinessObjects Dashboards 4.0 Cookbook now with the O’Reilly learning platform.
O’Reilly members experience books, live events, courses curated by job role, and more from O’Reilly and nearly 200 top publishers.

