Chapter 9. Logstash
Managing logs is difficult. It gets even more complicated when your infrastructure is bigger. And, making it dynamic (changing instances, all the time) doesn’t help at all.
You have commercial services like Splunk and Loggly, but they can get very expensive, very quickly. We would prefer to run it ourselves, providing that the following are true:
- We can design this to be reliable.
- It has a small footprint for log shipping.
- It comes with out of the box interface for reading (analyzing).
- It is scalable.
Logstash calls itself a log management solution. You can collect events, parse them (add meaning), search, and store them. Logstash can be easily decoupled, and run in a setup (see Figure 9-1).
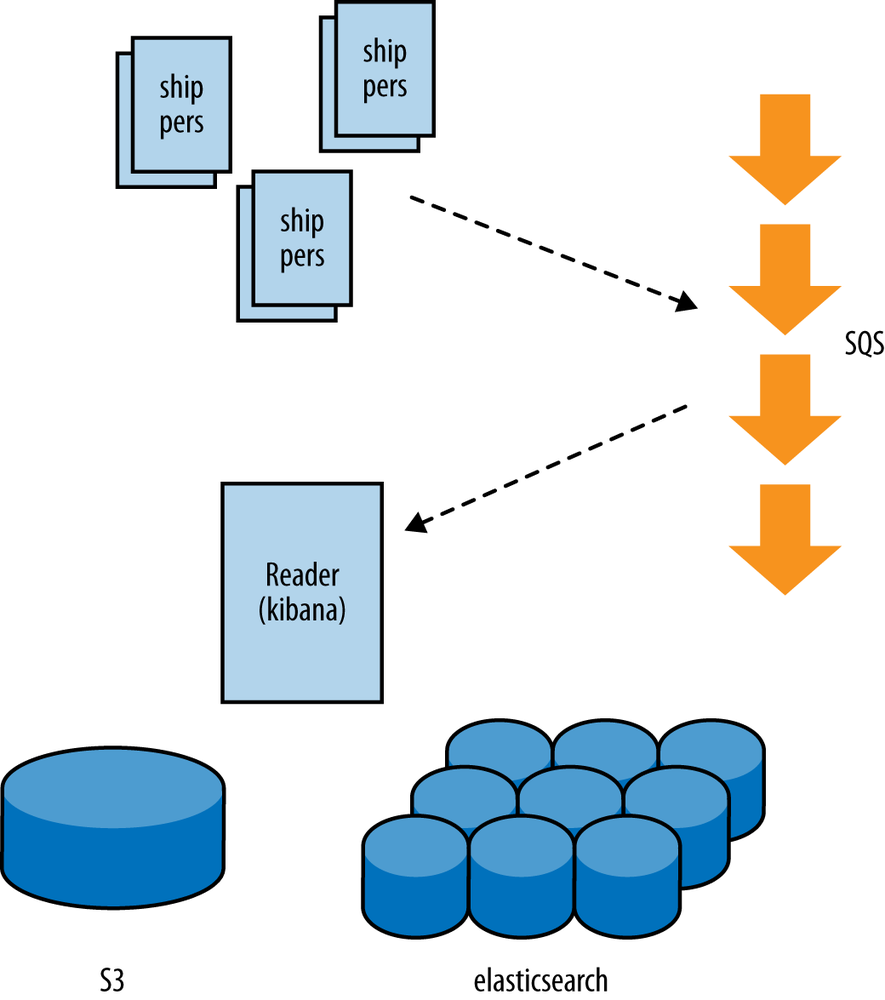
Figure 9-1. Logstash distributed logging
The base setup should be able to handle several hundred events per second. The shippers have a small footprint. The reader (and interface) run on high CPU medium. For the elasticsearch (powering the interface) we’ll use two high memory medium instances.
Build
Logstash works with input, filter, and output definitions. Most of the time shippers read from file (input), do not filter very much, and write out to a middleware message bus (output). Logstash comes with many plug-ins.
The default isolated message bus is RabbitMQ; you can also use Redis, but we want to use SQS, of course.
The latest logstash.jar comes with the AWS SDK. This means ...
Get Resilience and Reliability on AWS now with the O’Reilly learning platform.
O’Reilly members experience books, live events, courses curated by job role, and more from O’Reilly and nearly 200 top publishers.

