Monitoring storage performance
In this recipe, we'll look at the following metrics:
disk.all.readdisk.all.writedisk.all.read_bytesdisk.all.write_bytes
How to do it…
Let's create a text and graphical representation of the performance data through the following steps:
- Display live data for the preceding metrics; you can use the following command for this:
~]# pmdumptext -H -t 1 -i -l disk.all.read disk.all.write disk.all.read_bytes disk.all.write_bytes -h guest.example.com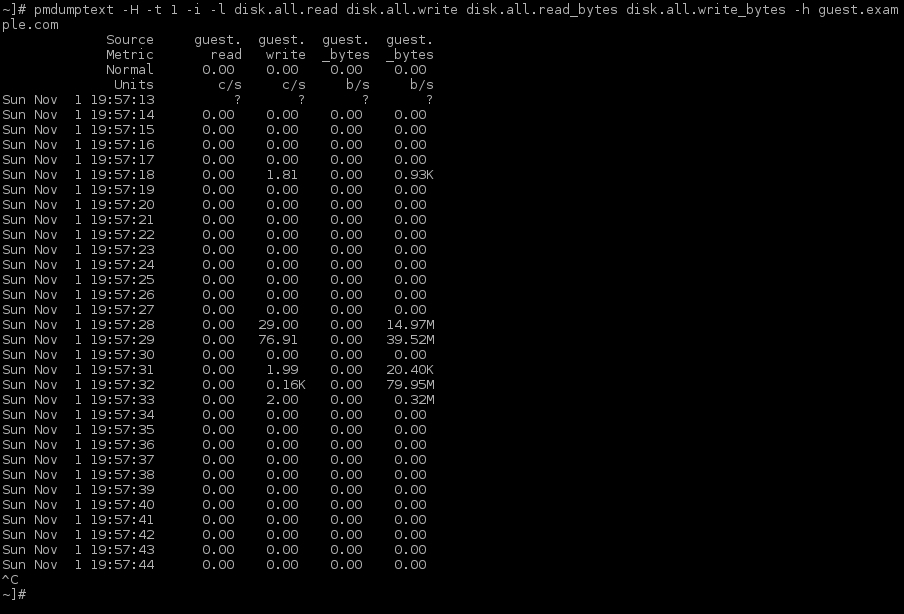
- Next, create a configuration file for
pmchartto display live data calleddisk.confwith the following contents:#kmchart version 1 chart style stacking plot color #ffff00 metric mem.util.used ...
Get Red Hat Enterprise Linux Server Cookbook now with the O’Reilly learning platform.
O’Reilly members experience books, live events, courses curated by job role, and more from O’Reilly and nearly 200 top publishers.

