Constructing a bar plot using XML in R
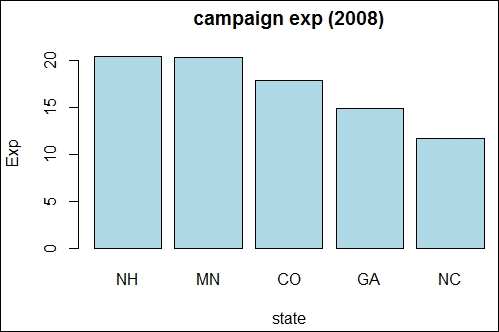
In the prior recipe, we learned to construct an API, studied various elements of an API, and imported data using the New York Times API. In this section, we will go a step further and import the data directly in R, parse the XML data, construct and structure our data, and plot a bar plot. For this recipe, we will use the New York Times website, but instead of real estate data, we will use the campaign finance data. The bar plot is shown as follows:
Getting ready
In order to extract data from the New York Times and generate a bar plot, we would use the XML package and the generic plot function in R.
How to do it… ...
Get R: Recipes for Analysis, Visualization and Machine Learning now with the O’Reilly learning platform.
O’Reilly members experience books, live events, courses curated by job role, and more from O’Reilly and nearly 200 top publishers.

