Generating a quantile-quantile plot (QQ plot)
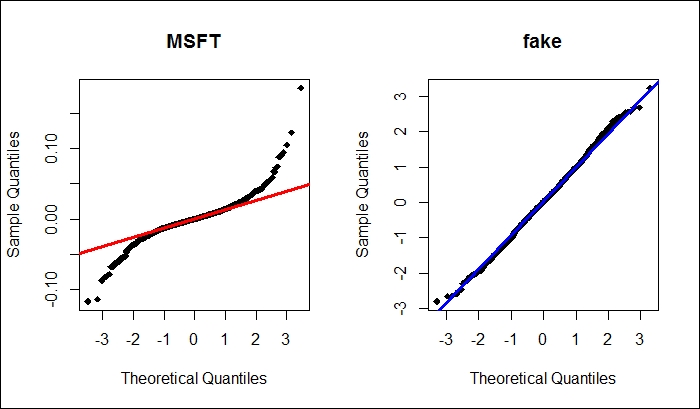
QQ plots are mainly used in academic literature to test for normality. R comes with some basic methods to test for normality, such as the Shapiro test. The Jarque-Bera test is another such normality test that is available with the tseries package. Many times, we are interested in understanding how much our data deviates from a normally distributed data.
One of the hot topics in finance is the study of fat tails in stock markets. Researchers have observed that equity prices or stock returns do not have a normal distribution and the actual distribution of returns contains fat tails.
Getting ready
We need ...
Get R: Recipes for Analysis, Visualization and Machine Learning now with the O’Reilly learning platform.
O’Reilly members experience books, live events, courses curated by job role, and more from O’Reilly and nearly 200 top publishers.

