Constructing a box and whiskers plot
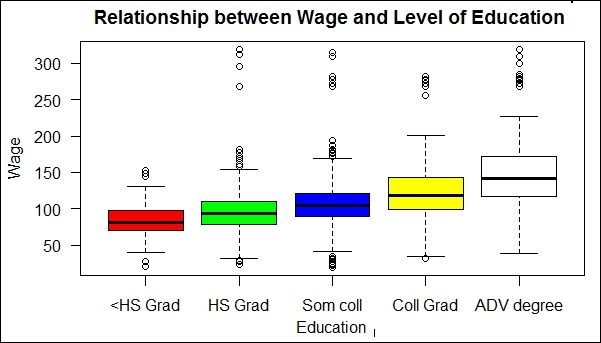
Box plots, also known as box and whisker diagrams, assist us in studying the distribution of the data and also provide us with information regarding the outliers. Box plots display the minimum, maximum, median, and interquartile range of each variable in the data. The Flowing Data website provides a very detailed description on how to read a box plot. The following plot shows the distribution and the outliers of wage data. We observe that as the level of education increases, the wage earned also increases.
Getting ready
Box plots are generated in R using the basic R package. The wage data used to generate the box ...
Get R: Recipes for Analysis, Visualization and Machine Learning now with the O’Reilly learning platform.
O’Reilly members experience books, live events, courses curated by job role, and more from O’Reilly and nearly 200 top publishers.

