Generating interactive candlestick plots
We have learned a quick and easy way to plot a candlestick. In this recipe, we will learn an easy way to generate an interactive version of the same plot. The advantage of using an interactive plot is that the audience is able to interact with the visualization and this removes the guess work. Audience can hover over the chart and the values are displayed as a tooltip.
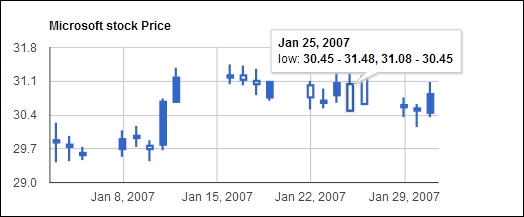
In this visualization, whenever the opening value is less than the closing value, the candlestick is filled with blue (implying a gain). Whenever the opening value is more than the closing value, the candlestick is hollow (implying a loss). ...
Get R: Recipes for Analysis, Visualization and Machine Learning now with the O’Reilly learning platform.
O’Reilly members experience books, live events, courses curated by job role, and more from O’Reilly and nearly 200 top publishers.

