Constructing a radial plot
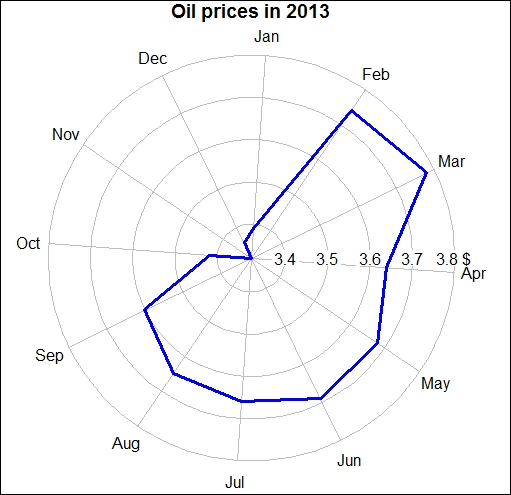
The main idea behind a radial plot is to project the data as a distance from the centre in a circular form. Radial plots are not observed very often but are good tools to visualize monthly time series data. In this recipe, we will use oil prices in USA as an example to construct the radial plot.
Getting ready
In order to create a radial plot, we need to load the plotrix package.
How to do it…
We can install the package as well as load the library in our active R session by typing the following lines in the R console window:
install.packages("plotrix")
library(plotrix)
The data consists of 21 years of monthly data for oil prices ...
Get R: Recipes for Analysis, Visualization and Machine Learning now with the O’Reilly learning platform.
O’Reilly members experience books, live events, courses curated by job role, and more from O’Reilly and nearly 200 top publishers.

