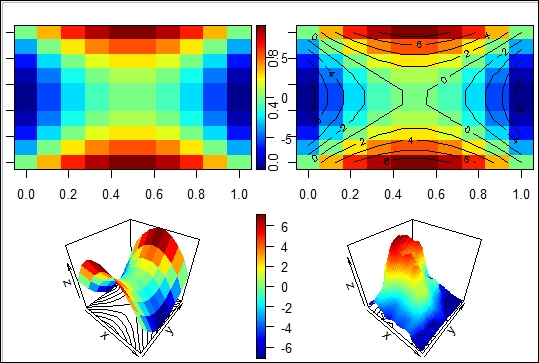
Integrating a 3D contour and a surface plot
We have studied contour plots in the recipe A guide to contour maps in Chapter, Maps. In this recipe, we will learn to plot a contour map in 3D using the plot3D package in R. Readers who are interested in studying contour plots should refer to the See also section of this recipe.
Getting ready
For the purpose of the current recipe, we will install and load the plot3D package in R.
How to do it…
We will install and load the plot3D package in R using the following lines of code:
install.packages("plot3D")
library(plot3D)
We now generate some data to construct our plots. This step is exactly the same step discussed ...
Get R: Recipes for Analysis, Visualization and Machine Learning now with the O’Reilly learning platform.
O’Reilly members experience books, live events, courses curated by job role, and more from O’Reilly and nearly 200 top publishers.

