Generating a 3D contour plot
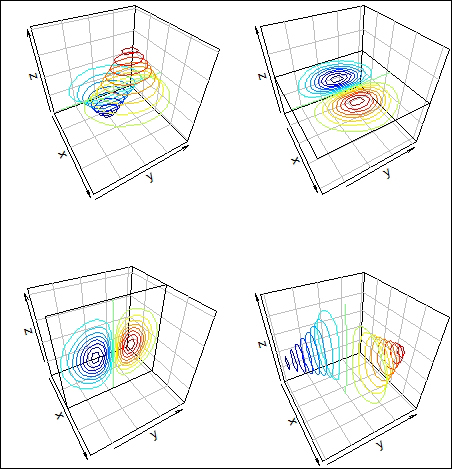
The plot3D package allows us to construct 3D contours and also slice them. In the current recipe, I have explained the implementation of 3D contours in R. The manual to the package discusses many different examples.
Getting ready
We will install the plot3D package to generate 3D contours in R.
How to do it…
The implementation of contour 3D is very similar to the histogram discussed in the previous recipe. We will first install and load the plot3D package in R using the following lines of code:
install.packages("plot3D")
library(plot3D)
We will now create a layout for our image. We will generate four different contour plots ...
Get R: Recipes for Analysis, Visualization and Machine Learning now with the O’Reilly learning platform.
O’Reilly members experience books, live events, courses curated by job role, and more from O’Reilly and nearly 200 top publishers.

