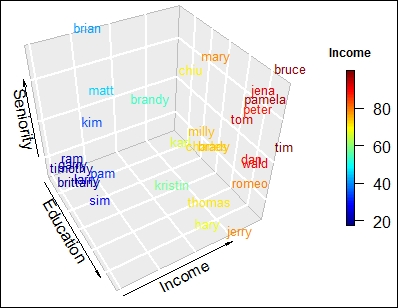
Generating a 3D scatter plot with text
The main objective of writing this recipe is to introduce the reader to the additional functionality of the plot3D package. Applying text to a plot provides readers with additional information. If the dataset is large, we might encounter the issue of overlapping text, but it is a great tool to explore and present data.
The package under the code title Two ways to make a scatter 3D of quakes dataset provides an interesting implementation of the scatter3D() function, where the data points in 3D space are projected on a 2D space.
Getting ready
For the current recipe, we would install and load the plot3D package in ...
Get R: Recipes for Analysis, Visualization and Machine Learning now with the O’Reilly learning platform.
O’Reilly members experience books, live events, courses curated by job role, and more from O’Reilly and nearly 200 top publishers.

