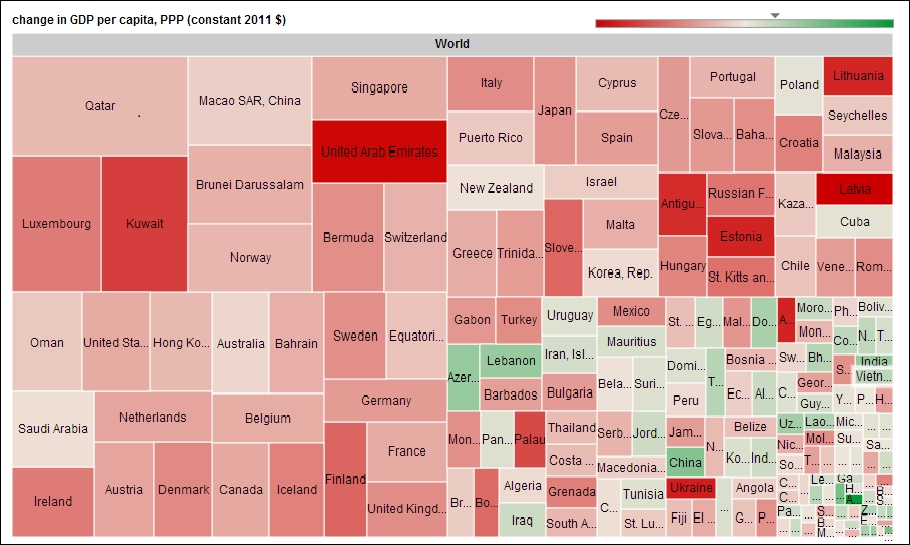
Constructing a tree map in R
Tree maps are basically rectangles placed adjacent to each other. The size of each rectangle is directly proportional to the data being used in the visualization. Tree maps have been used to plot the most watched news on the web by newsmap.jp. They have also been applied in financial websites such as smart money to visualize financial market movements. In this recipe, we will implement a tree map using the googleVis package.
Getting ready
We would require to install and load the googleVis package for the purpose of the visualization.
How to do it…
In order to implement a tree map, we would first install and load the googleVis ...
Get R: Recipes for Analysis, Visualization and Machine Learning now with the O’Reilly learning platform.
O’Reilly members experience books, live events, courses curated by job role, and more from O’Reilly and nearly 200 top publishers.

