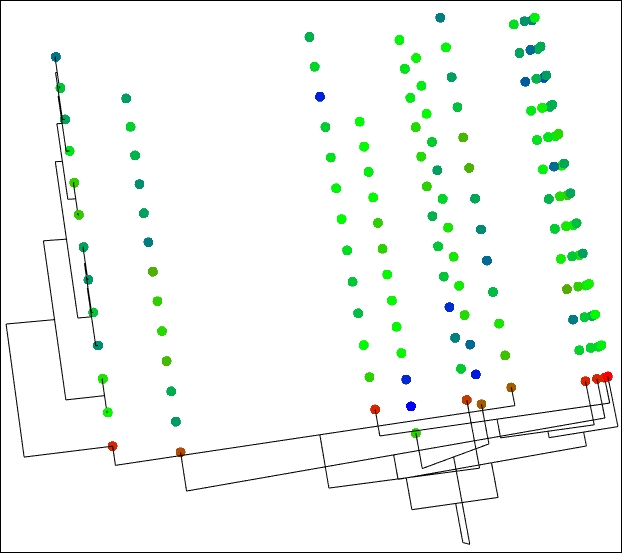
Creating a three-dimensional heat map and a stereo map
We have studied two-dimensional heat maps, but R also allows us to plot three-dimensional interactive heat maps using the NeatMap package. The NeatMap package manual states the limitation of using the heatmap() function as "The traditional clustered heatmap makes use of cluster analysis to re-order rows and columns such that similar elements are placed together. However, cluster analysis is a poor choice for ordering method since this does not provide a unique ordering".
Getting ready
In order to plot a three-dimensional heat map and a stereo map, we would need to install the NeatMap package available ...
Get R: Recipes for Analysis, Visualization and Machine Learning now with the O’Reilly learning platform.
O’Reilly members experience books, live events, courses curated by job role, and more from O’Reilly and nearly 200 top publishers.

