Creating dendrograms with colors and labels
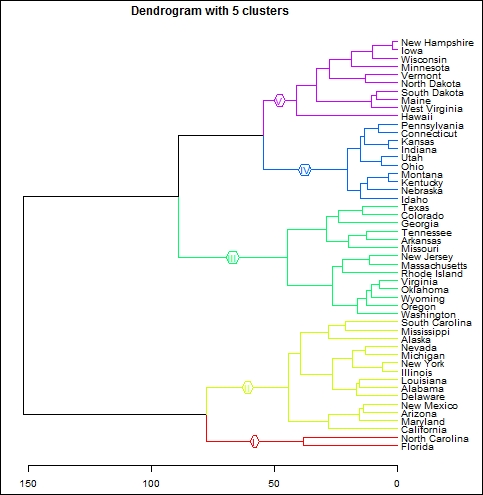
The dendrogram plot in the previous example was all black and white. While making a good presentation, we would like this to be more informative. We would also like our audience to look at the dendrogram and immediately spot clusters and relationships among variables. We will now move a bit away from basic R plots and use a package called dendroextras. A sample dendrogram is as follows:
Getting ready
For creating a plot that is easy to interpret and study, we would use the dendroextras package.
For a better understanding on installing packages in R, please refer to the recipe Installing packages and getting ...
Get R: Recipes for Analysis, Visualization and Machine Learning now with the O’Reilly learning platform.
O’Reilly members experience books, live events, courses curated by job role, and more from O’Reilly and nearly 200 top publishers.

