Constructing a waterfall plot in R
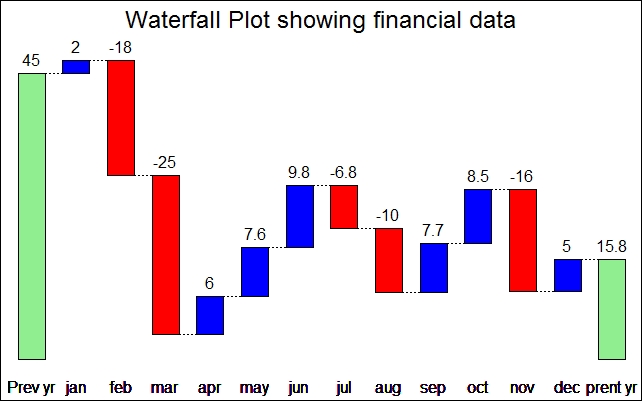
The waterfall plots or staircase plots are observed mostly in financial reports. I have not come across a nonfinancial application of these plots. The first and last columns of the plot are usually a total column and the floating columns indicate the incremental change. In this recipe, we generate some fake data of sales figures for every month.
Getting ready
In order to generate a waterfall plot, we will need to install and load the plotrix package in R.
How to do it…
The data for the same is imported in R using the read.csv() function. If we view the data, it begins with a total from last year's sales and we have ...
Get R: Recipes for Analysis, Visualization and Machine Learning now with the O’Reilly learning platform.
O’Reilly members experience books, live events, courses curated by job role, and more from O’Reilly and nearly 200 top publishers.

