Merging histograms
Histograms help in studying the underlying distribution. It is more useful when we are trying to compare more than one histogram on the same plot; this provides us with greater insight into the skewness and the overall distribution.
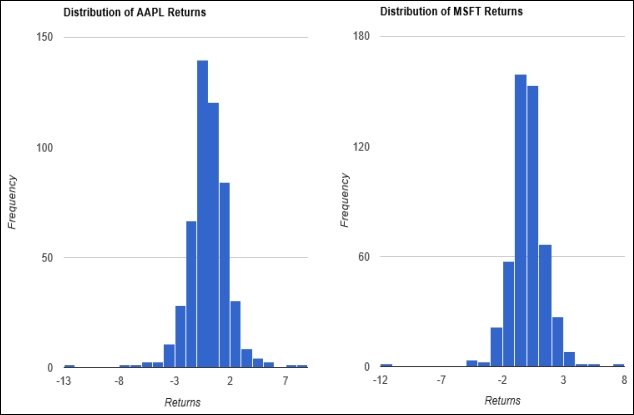
In this recipe, we will study how to plot a histogram using the googleVis package and how we merge more than one histogram on the same page. We will only merge two plots but we can merge more plots and try to adjust the width of each plot. This makes it easier to compare all the plots on the same page. The following plot shows two merged histograms:
How to do it…
In order to generate a histogram, we will ...
Get R: Recipes for Analysis, Visualization and Machine Learning now with the O’Reilly learning platform.
O’Reilly members experience books, live events, courses curated by job role, and more from O’Reilly and nearly 200 top publishers.

