Generating an interactive Gantt/timeline chart in R
Wikipedia describes a Gantt chart as "illustrate the start and finish dates of the terminal elements and summary elements of a project". These charts are used to track the progress of a project displayed against time. The first Gantt chart was developed by Karol Adamiecki in 1890.
Even though the most important application of Gantt charts is in project management, they have been applied in visualization to represent the following:
- Historical era of artist
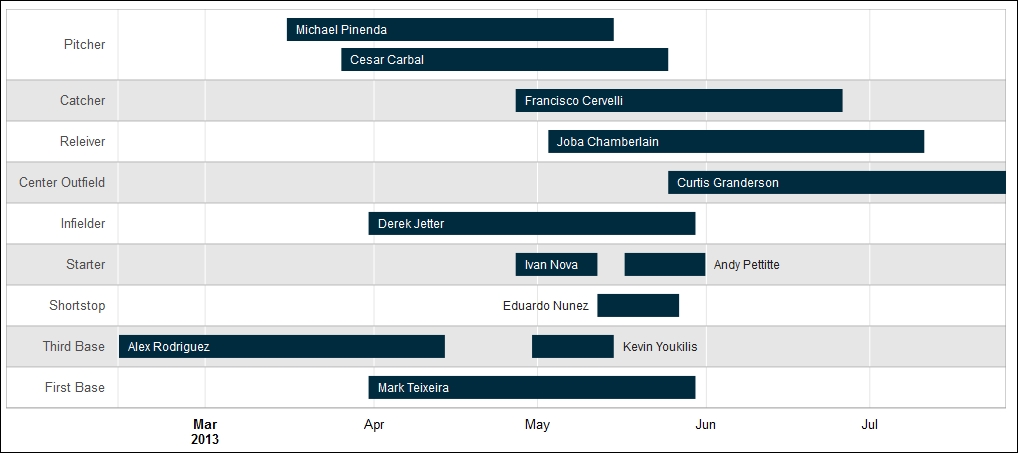
- Periods during which baseball players are disabled
- Vanishing Wall Street firms
Getting ready
To generate a timeline plot, we will need to install ...
Get R: Recipes for Analysis, Visualization and Machine Learning now with the O’Reilly learning platform.
O’Reilly members experience books, live events, courses curated by job role, and more from O’Reilly and nearly 200 top publishers.

