A simple bar plot
A bar plot can often be confused with histograms (studied later in this chapter). Histograms are used to study the distribution of data whereas bar plots are used to study categorical data. Both the plots may look similar to the naked eye but the main difference is that the width of a bar plot is not of significance, whereas in histograms the width of the bars signifies the frequency of data.
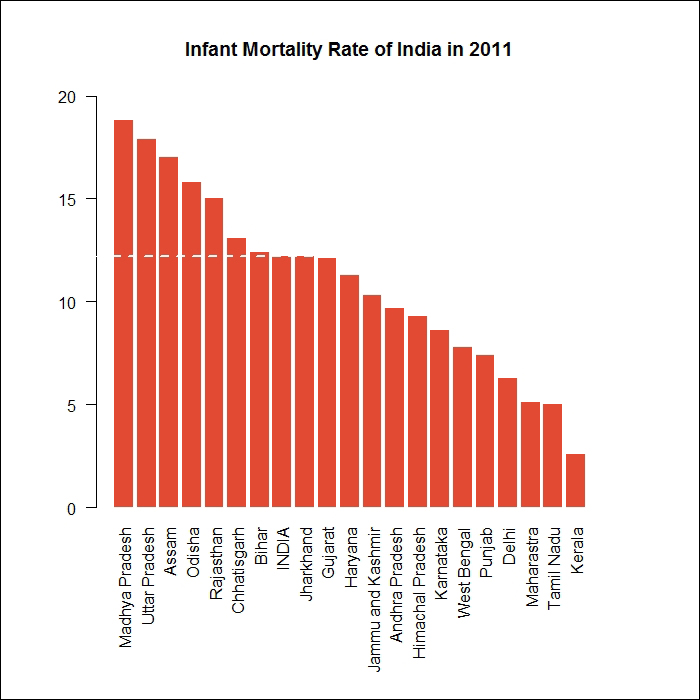
In this recipe, I have made use of the infant mortality rate in India. The data is made available by the Government of India. The main objective is to study the basics of a bar plot in R as shown in the following screenshot:
How to do it…
We ...
Get R: Recipes for Analysis, Visualization and Machine Learning now with the O’Reilly learning platform.
O’Reilly members experience books, live events, courses curated by job role, and more from O’Reilly and nearly 200 top publishers.

