Visualizing a recursive partitioning tree
From the last recipe, we learned how to print the classification tree in text format. To make the tree more readable, we can use the plot function to obtain the graphical display of a built classification tree.
Getting ready
You need to have the previous recipe completed by generating a classification model, and assign the model into variable fit.
How to do it…
Perform the following steps to visualize the classification tree:
- Use the
plotandtextfunctions to plot the classification tree:> plot(fit, margin= 0.1) > text(fit, all=TRUE, use.n = TRUE)
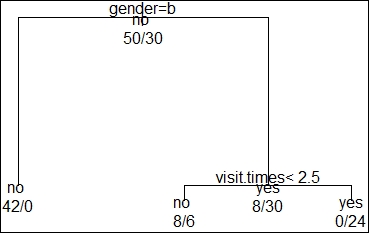
Figure 8: The classification tree of the customer dataset
- You ...
Get R for Data Science Cookbook now with the O’Reilly learning platform.
O’Reilly members experience books, live events, courses curated by job role, and more from O’Reilly and nearly 200 top publishers.

