Plotting a time series object
Plotting a time series object will make trends and seasonal composition clearly visible. In this recipe, we introduce how to plot time series data with the plot.ts function.
Getting ready
Ensure you have completed the previous recipe by generating a time series object and storing it in two variables: m and m_ts.
How to do it…
Please perform the following steps to plot time series data:
- First, use the
plot.tsfunction to plot time series data,m:> plot.ts(m)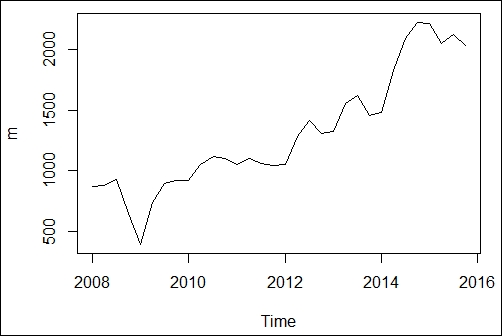
Figure 1: A time series plot of single time series data
- Also, if the dataset contains multiple time series objects, you can plot multiple time series data in a separate ...
Get R for Data Science Cookbook now with the O’Reilly learning platform.
O’Reilly members experience books, live events, courses curated by job role, and more from O’Reilly and nearly 200 top publishers.

