Visualizing association rules
To explore the relationship between items, one can visualize the association rules. In the following recipe, we introduce how to use the arulesViz package to visualize association rules.
Getting ready
In this recipe, one has to have completed the previous recipe by generating rules and have these stored in a variable named rules.pruned.
How to do it…
Please perform the following steps to visualize association rules:
- First, install and load the
arulesVizpackage:> install.packages("arulesViz") > library(arulesViz)
- You can then make a scatterplot from the pruned rules:
> plot(rules.pruned)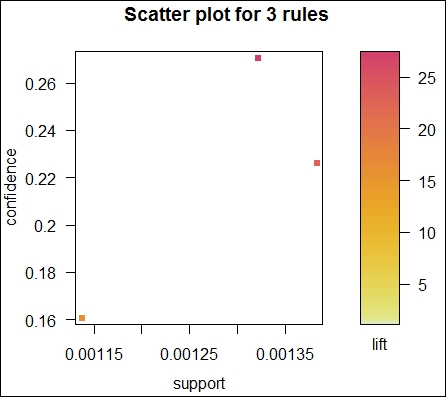
Figure 3: The scatterplot of pruned ...
Get R for Data Science Cookbook now with the O’Reilly learning platform.
O’Reilly members experience books, live events, courses curated by job role, and more from O’Reilly and nearly 200 top publishers.

