Part I. Explore
The goal of the first part of this book is to get you up to speed with the basic tools of data exploration as quickly as possible. Data exploration is the art of looking at your data, rapidly generating hypotheses, quickly testing them, then repeating again and again and again. The goal of data exploration is to generate many promising leads that you can later explore in more depth.
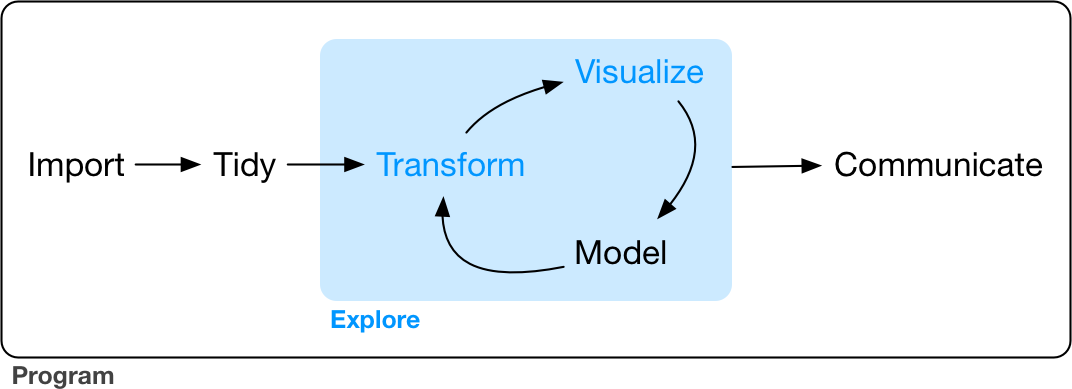
In this part of the book you will learn some useful tools that have an immediate payoff:
-
Visualization is a great place to start with R programming, because the payoff is so clear: you get to make elegant and informative plots that help you understand data. In Chapter 1 youâll dive into visualization, learning the basic structure of a ggplot2 plot, and powerful techniques for turning data into plots.
-
Visualization alone is typically not enough, so in Chapter 3 youâll learn the key verbs that allow you to select important variables, filter out key observations, create new variables, and compute summaries.
-
Finally, in Chapter 5, youâll combine visualization and transformation with your curiosity and skepticism to ask and answer interesting questions about data.
Modeling is an important part of the exploratory process, but you donât have the skills to effectively learn or apply it yet. Weâll come back to it in Part IV, once youâre better equipped with more data ...
Get R for Data Science now with the O’Reilly learning platform.
O’Reilly members experience books, live events, courses curated by job role, and more from O’Reilly and nearly 200 top publishers.

