Separating investment targets
An alternative method to build an investment strategy could be to separate good investment targets and check what is common between them. A good way to find similarities among stocks that performed well could be to create groups based on the TRS values and compare low- and high-performer clusters. The first step to this should be to analyze the following code:
library(stats)
library(matrixStats)
h_clust <- hclust(dist(d[,19]))
plot(h_clust, labels = F, xlab = "")
The following dendogram is the output for the preceding code:
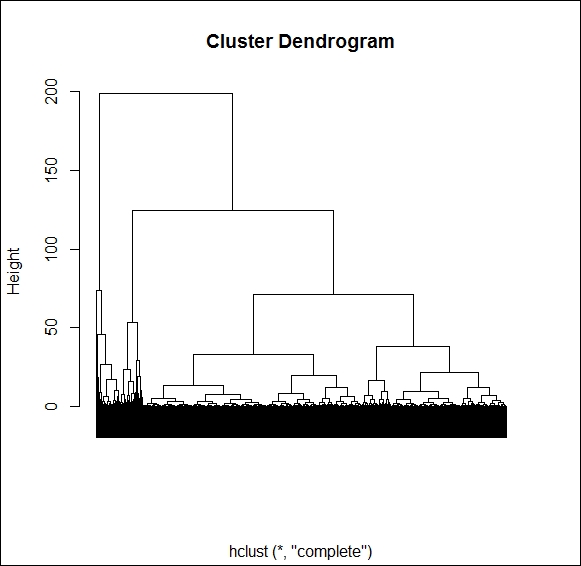
Based on the dendrogram, three clusters separate very well, but to cut the biggest of them into ...
Get R: Data Analysis and Visualization now with the O’Reilly learning platform.
O’Reilly members experience books, live events, courses curated by job role, and more from O’Reilly and nearly 200 top publishers.

