Creating horizontal box plots
In this recipe, we will learn how to make box plots with horizontal boxes instead of the default vertical ones.
Getting ready
We will continue using the base graphics library functions, so we need not load any additional package. We just need to run the recipe code at the R prompt. We can also save the code as a script to use it later. Here, we will use the metals.csv example dataset again:
metals<-read.csv("metals.csv")How to do it...
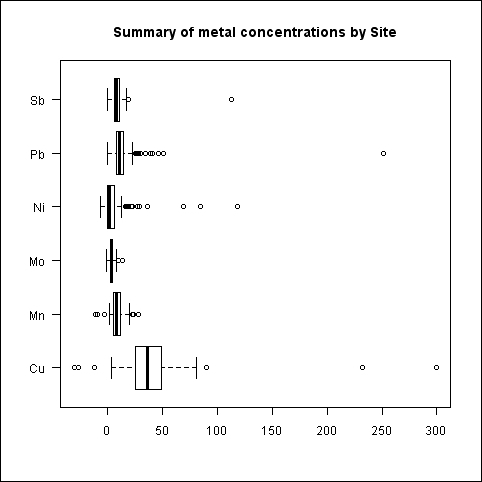
Let's draw the metals concentration box plot with horizontal bars:
boxplot(metals[,-1],
horizontal=TRUE,las=1,
main="Summary of metal concentrations by Site")
How it works...
We simply had to ...
Get R: Data Analysis and Visualization now with the O’Reilly learning platform.
O’Reilly members experience books, live events, courses curated by job role, and more from O’Reilly and nearly 200 top publishers.

