Adjusting the orientation of bars – horizontal and vertical
In this recipe, we will learn how to adjust the orientation of bars to horizontal or vertical.
Getting ready
We will use the same dataset we used in the last few recipes (citysales.csv) and the RColorBrewer color palette package.
How to do it...
Let's make a bar chart with horizontal bars:
barplot(as.matrix(citysales[,2:4]), beside=TRUE,horiz=TRUE,
legend.text=citysales$City, args.legend=list(bty="n"),
col=brewer.pal(5,"Set1"),border="white",
xlim=c(0,100), xlab="Sales Revenue (1,000's of USD)",
main="Sales Figures")
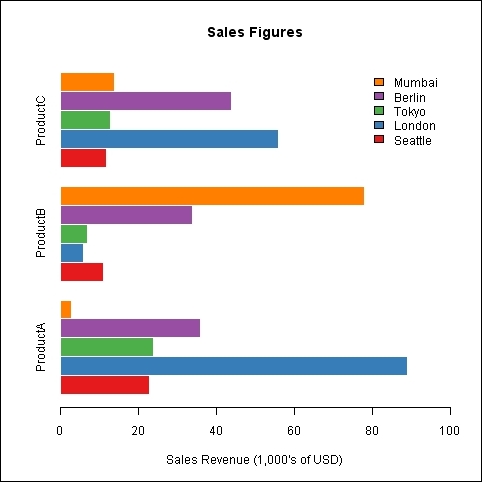
How it works...
In the example, we set the horiz argument to TRUE, which makes ...
Get R: Data Analysis and Visualization now with the O’Reilly learning platform.
O’Reilly members experience books, live events, courses curated by job role, and more from O’Reilly and nearly 200 top publishers.

